TIDUE90 July 2018
- Description
- Resources
- Features
- Applications
- Design Images
- 1System Description
- 2System Overview
- 3Hardware, Software, Test Requirements, and Test Results
- 4Design Files
- 5Software Files
- 6Related Documentation
- 7About the Author
3.2.2 Conductive Noise Immunity Test
Test Setup
The test setup follows the IEC 61000-4-6 standard and complies with the guidelines provided in the standard. Three separate tests must be performed for conducted immunity:
- Class B verification with the standard frequency sweep as specified to ensure that no false detects occur for any sensor due to the noise
- Class A verification for a single button must remain in detect for the test to ensure that valid touches can be detected in the presence of noise throughout the frequency range.
- Class A verification of the functionality of the entire panel while at specific frequencies that are most susceptible to conducted noise.
This reference design is tested under the IEC 61000-4-6 test level 2 with 3-Vrms test voltage. The noise is coupled directly onto the 3.3-V system power supply.
Test Procedures
Two types of test data are shown: frequency sweeps and frequency dwells. Frequency sweeps are tests in which the response of an electrode is measured while the noise frequency is swept. The response is tested with and without a simulated touch present. Frequency dwells are tests in which the response of an electrode is measured while the noise frequency is held constant. The response to several sequential touches is tested to compare the touched and untouched states.
Test Result
There are four data sets for this test: a sweep with no touch, a sweep with a touch, and two dwell tests, one for dry condition and another for flowing water condition.
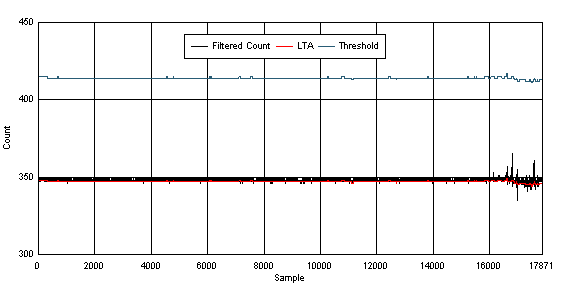
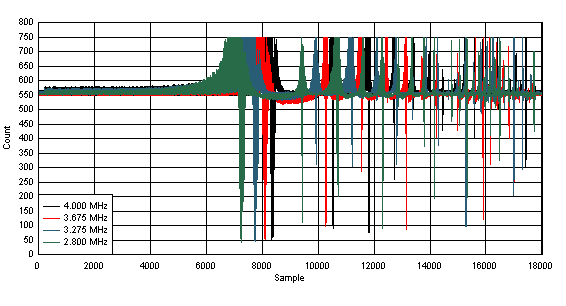
Figure 22 shows the result of the frequency sweep with no touch. The filtered count remains below the touch threshold throughout the test with no false button detection. The raw data (4 MHz, 3.675 MHz, 3.275 MHz, 2.800 MHz) identifies the fundamental conversion frequencies and the harmonics. When the noise frequency overlaps with a conversion frequency or one of its harmonics, the measurements at that conversion frequency exhibit corrupted and unusable data. The other frequencies remain undisturbed. The sweep with no touch passes the test with no false detections.

 Figure 22. Sensor Data for 3 Vrms Conductive Noise Test; No Touch Sweep; Dry Condition
 Figure 23 shows the result of the frequency sweep with touch. The noise level increases when a button is touched. The filtered count has more fluctuations, especially near the primary base-conversion frequency at 4 MHz. In the raw data (4 MHz, 3.675 MHz, 3.275 MHz, 2.800 MHz), the noise amplitude increases and the noise bandwidth expands. Overall, the filtered count remains above the touch threshold throughout the test, which means that the button did not exit the detection throughout the test. The sweep with touch passes the test.

 Figure 23. Sensor Data for 3 Vrms Conductive Noise Test; Touched Sweep; Dry Condition
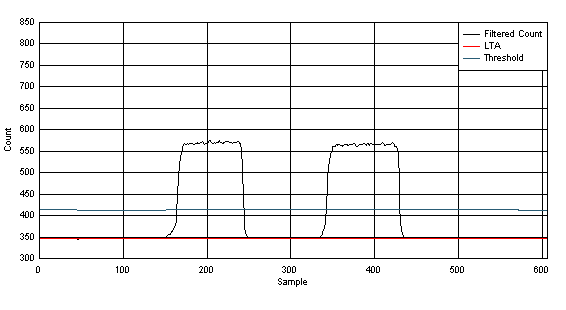
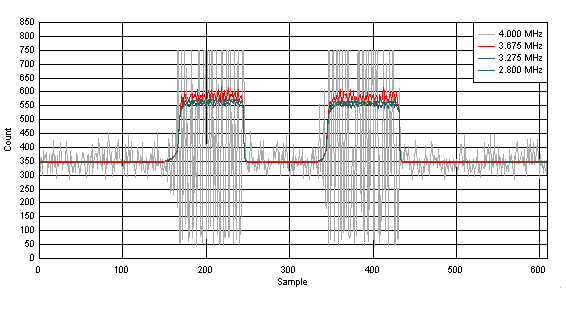
 The 4-MHz dwell point was chosen because it directly overlaps with the primary base-conversion frequency of 4 MHz. Figure 24 shows two sequential touches under dry condition. The dominant noise is present only in the raw data at 4 MHz. The filtered count remains below the threshold when there is no touch and remains above the threshold with no fluctuations when there is a touch. This is a passing dwell test.

 Figure 24. Sensor Data for 3 Vrms Conductive Noise Test; Dwell at 4 MHz, Dry Condition
 Figure 25 shows the dwell test result at 4 MHz with two sequential touches under the flowing water condition. Similar to the dwell test in dry conditions, the dominant noise is present only in the raw data at 4 MHz. The filtered count remains below the threshold when there is no touch and remains above the threshold with no fluctuations when there is a touch. This is a passing dwell test.

 Figure 25. Sensor Data for 3 Vrms Conductive Noise Test; Dwell at 4 MHz, Flowing Water