TIDUE90 July 2018
- Description
- Resources
- Features
- Applications
- Design Images
- 1System Description
- 2System Overview
- 3Hardware, Software, Test Requirements, and Test Results
- 4Design Files
- 5Software Files
- 6Related Documentation
- 7About the Author
3.2.3.1 Continuous Water Flow Test
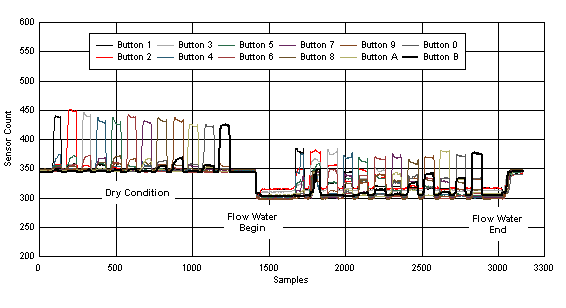
Figure 26 shows the sensor measurement count results for this test. The Y axis represents the sensor measurement count and the X axis represents number of samples. Each color represents the data for a specific button. The data shows that the sensors are calibrated at baseline count of 350, and the touch increases the count to approximately 450 in dry conditions. The increased delta is smaller than the well grounded power supply scenario.
When the flowing water is applied on the touch sensor area, the data shows the "negative touch" behavior (see Section 2.2.3.2). The flowing water causes the measurement result to go in the opposite direction of a touch event, so no false touch is detected. While the water is continuously flowing on the touch sensor area, each touch event still causes a count increase, and the touched button is still distinguishable. However, the amplitude of the count increase is significantly lower compare to well grounded power supply scenario. As the data shows, it is challenge to set the touch threshold for the system to work reliably under both dry conditions and flowing water conditions. If the threshold tracks with the "negative touch" behavior, there could be a false detection after the flowing water is removed, because the data shows that the count returns to the baseline when the flowing water stops.
This data is only intended to demonstrate the sensitivity reduction, and Section 2.4.4 describes methods to design a system with stronger coupling to earth ground, which improves the sensitivity in flowing water conditions.
Section 2.4.4 explains the sensitivity reduction in battery powered system for both dry conditions and flowing water conditions. More water on the touch sensor area causes more significant sensitivity reduction. Section 3.2.3.2 describes the spray water test, which has less water applied to the touch surface, compared to the flowing water test.
 Figure 26. Sensor Count Result With Continuous Water Flow (Battery Power)