TIDUEJ6A January 2019 – July 2022
- Description
- Resources
- Features
- Applications
- 5
- 1System Description
- 2System Overview
- 3Hardware, Software, Testing Requirements, and Test Results
- 4Design and Documentation Support
- 5About the Authors
- 6Revision History
3.1.2.4 USS Design Center (PC GUI)
The MSP430 Ultrasonic Sensor Design Center Tool GUI included in this reference design lets developers modify some configuration parameters required to test different transducers, as well as observe the behavior of the system in real time.
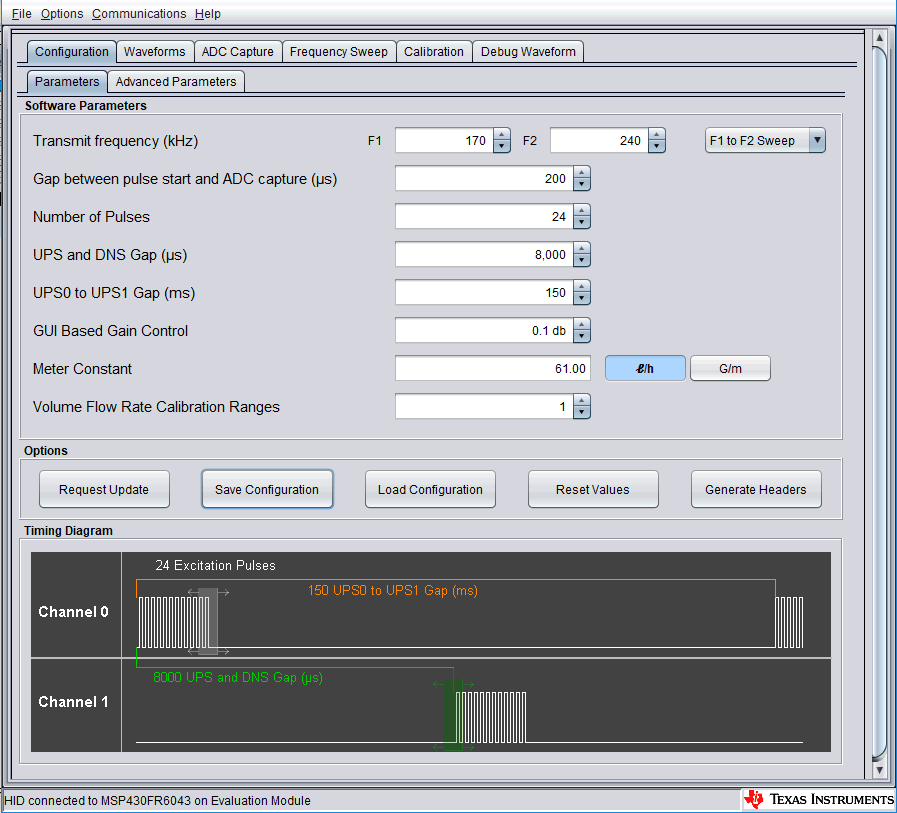
The configuration window is shown by default when opening the application (see Figure 4-6).
 Figure 4-6 GUI Configuration Parameters Window
The configuration window lets developers configure the parameters detailed in Table 4-2.
| Parameter | Description |
|---|---|
| Transmit Frequency (kHz) | Pulse output frequency (kHz) used to excite transducers |
| Gap between pulse start and ADC capture (µs) | Gap in microseconds between the generation of a pulse output and sampling of a received signal using SDHS |
| Number of Pulses | Number of pulses sent during pulse generation |
| UPS and DNS Gap (µs) | Gap in microseconds between upstream and downstream captures |
| UPS0 to UPS1 Gap (ms) | Gap in milliseconds between captures. This is measured from the end of the downstream capture to the start of the next upstream. |
| GUI-Based Gain Control | PGA gain setting in dB. This only takes specific values that are supported by the MSP430FR6043 MCU. |
| Meter Constant | Constant used to calculate the volume flow rate. This static constant is related to the cross section area of the meter that the vendor should provide as a one-time input. This also needs to vary depending on whether lph or gpm is used for the display. |
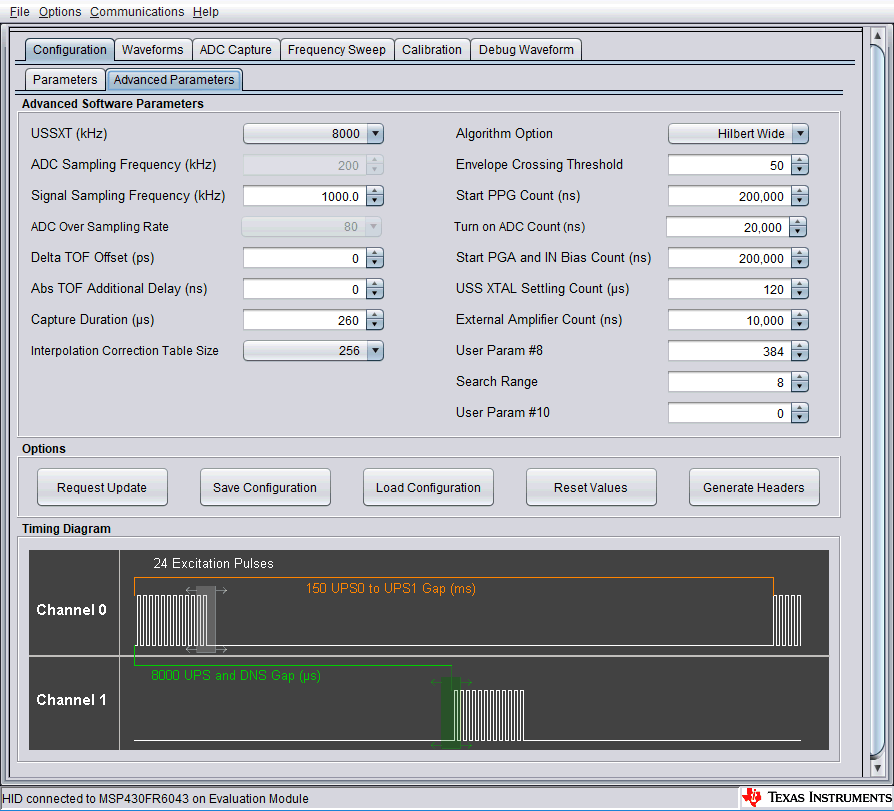
Figure 4-7 shows the Advanced Parameters configuration panel.
 Figure 4-7 GUI Advanced Parameters Configuration Window
The Advanced Parameters Configuration panel lists the parameters in Table 4-3.
| Parameter | Description |
|---|---|
| USSXT (kHz) | Frequency of X1 resonator in kHz connected to MSP430FR6043 on EVM430-FR6043 |
| ADC Sampling Frequency (kHz) | Reserved |
| Signal Sampling Frequency (kHz) | Sampling frequency of the received signal in kHz |
| ADC Oversampling Rate | Oversampling ratio (OSR) of the SDHS. This is 80 for signal sampling frequency in the range of [850 to 1000] kHz, and 40 for sampling frequency in the range of [1.7 to 2.0] MHz. |
| Delta ToF offset (ps) | Offset to compensate the delta ToF in picoseconds for any nonzero bias |
| Absolute ToF additional delay (ns) | Time in nanoseconds to compensate for unaccounted additional delays in absolute ToF |
| Capture Duration (µs) | Duration of the ADC capture in microseconds |
| Algorithm Option | Enables Lobe or Hilbert based algorithm |
| Envelope Crossing Threshold | Threshold from peak of AbsTOF correlation |
| Start PPG Count (ns) | Time to start PPG pulse trigger in nanoseconds. |
| Turnon ADC Count (ns) | Time to turn ON the ADC in nanoseconds. |
| Start PGA and IN Bias Count (ns) | Time to turn the PGA and input biasing in nanoseconds |
| USS XTAL Settling Count (µs) | Time allocated for USS crystal settling after initialization |
| External Amplifier Count (ns) | Time allocated for settling of the external amplifier |
| User Param 8 | Reserved |
| Search Range | Range over which AbsTOF is searched |
| User Param 10 | Reserved |
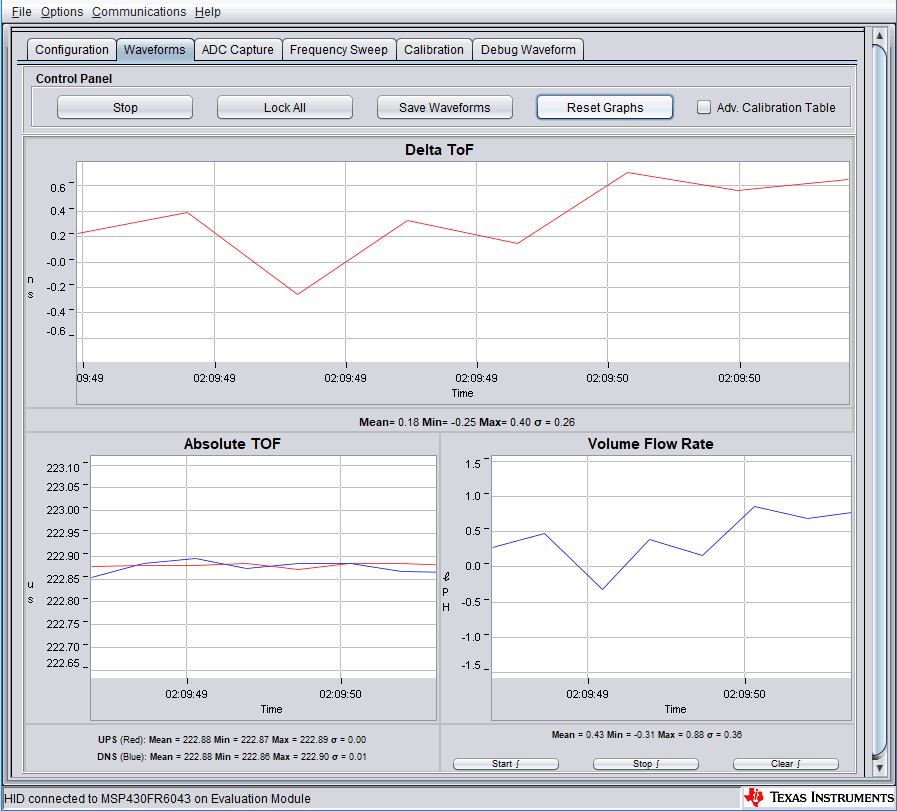
The MSP430 Ultrasonic Sensor Design Center Tool lets developers observe the behavior of the system in real time by using the Waveforms window, shown in Figure 4-8. This tool plots the delta time of flight (DToF) in the upper panel, the upstream absolute time of flight (AbsToFUPS) and downstream absolute time of flight (AbsToFDNS), and the volume flow rate (VFR). The plots include both the instantaneous measurement as well as the mean value of the measurements.
 Figure 4-8 USS Design Center GUI Waveforms Window
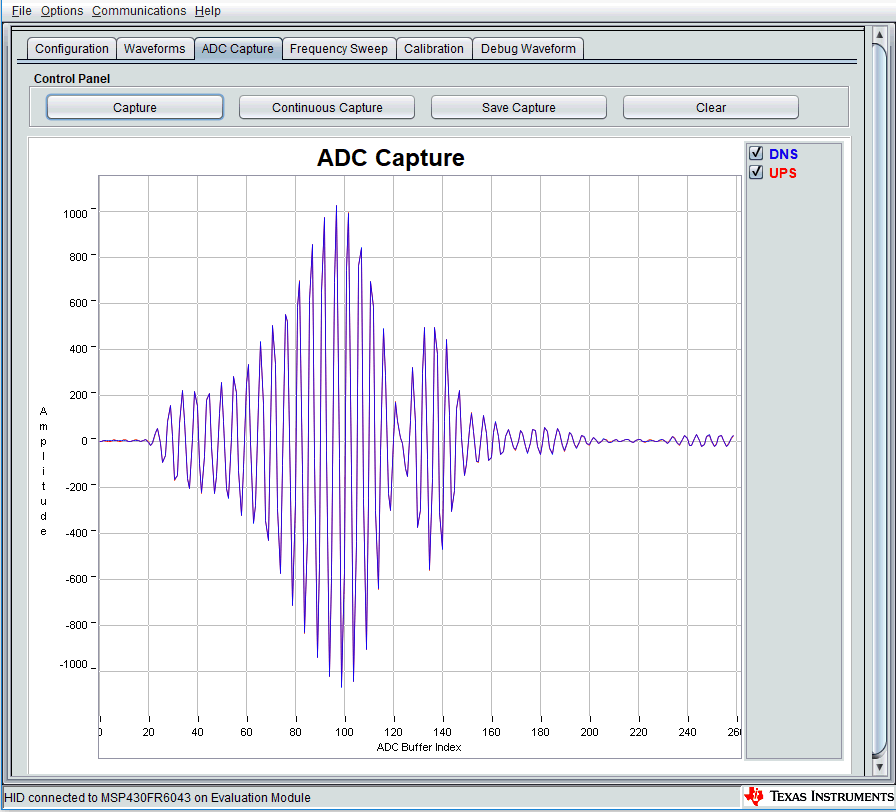
Additionally, it is also possible to obtain and plot a single capture to validate the integrity of the signal by using the ADC Capture panel (see Figure 4-9). The panel lets users obtain continuous captures of the ADC waveform of contiguous measurements and allows the user to do additional debugging if required.
 Figure 4-9 USS Design Center ADC Waveform Capture Window