TIDUEJ8C January 2019 – May 2024
- 1
- Description
- Resources
- Features
- Applications
- 6
- 1System Description
- 2System Overview
- 3Hardware, Software, Testing Requirements, and Test Results
- 4Design Files
- 5Related Documentation
- 6About the Author
- 7Revision History
3.2.2 Test Results
As Figure 3-5 and Figure 3-6 shows, in 12V battery system, peak efficiency is about 98.5% at 60W output power, European weighted efficiency is about 97.87%, in 24V battery system, peak efficiency is about 98.8% at 160W output power, European weighted efficiency is about 98.5%.
 Figure 3-5 Efficiency Curve Over Output Power for the 12V
System
 Figure 3-6 Efficiency Curve Over Output Power for the 24V
System
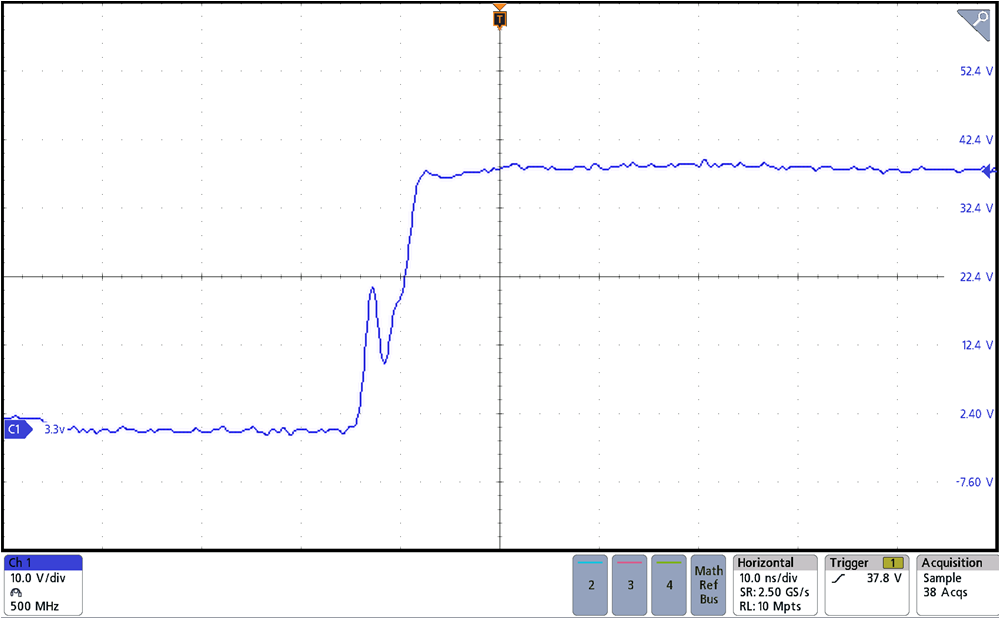
 Figure 3-7 Switch Nodes at 40V Input; 24V, 16A Output,
rising edge
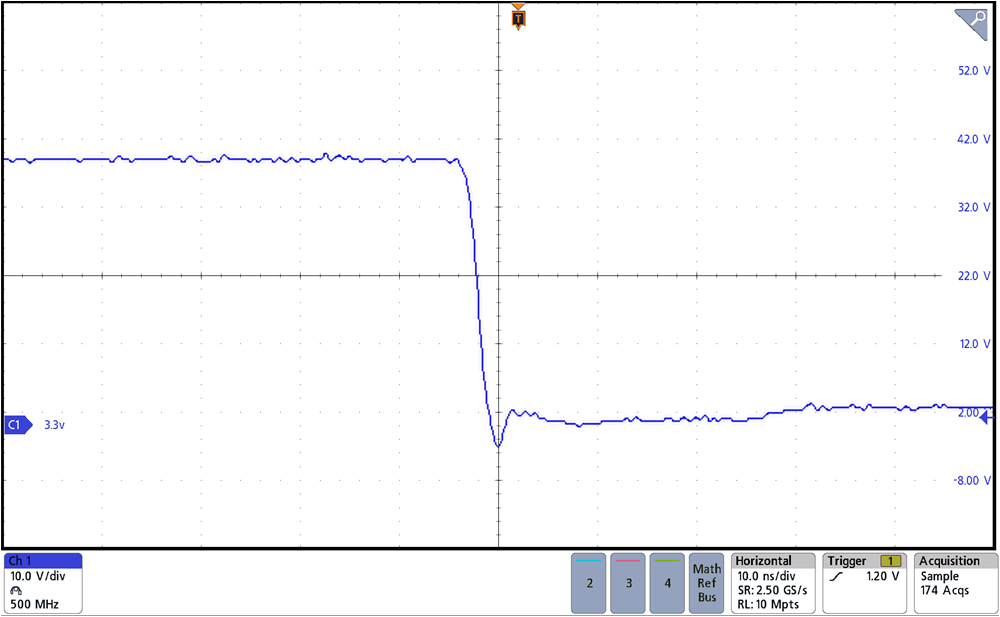
 Figure 3-8 Switch Nodes at 40V Input; 24V, 16A Output,
falling edge
Figure 3-8 Switch Nodes at 40V Input; 24V, 16A Output,
falling edgeFigure 3-7 show a 6ns rise time, with almost zero overshoot, Figure 3-8 shows a 4ns fall time. Both figures show a very good switching behavior of LMG2100.
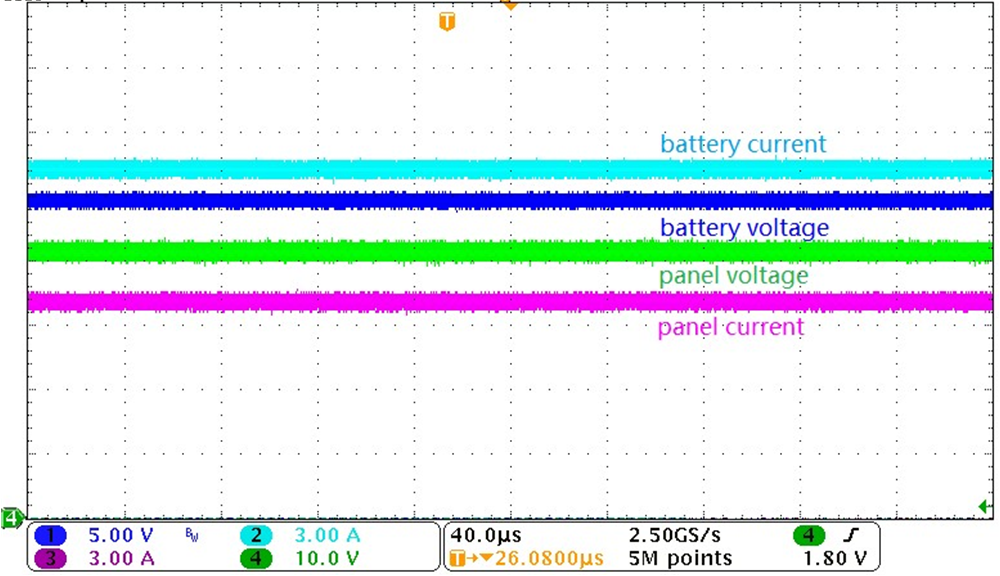
Figure 3-9 shows the battery current, battery voltage, panel current, and panel voltage at 400W output power. Input voltage is about 41V, output voltage is 24V.
 Figure 3-9 Battery Current, Battery Voltage, Panel Current and Panel Voltage
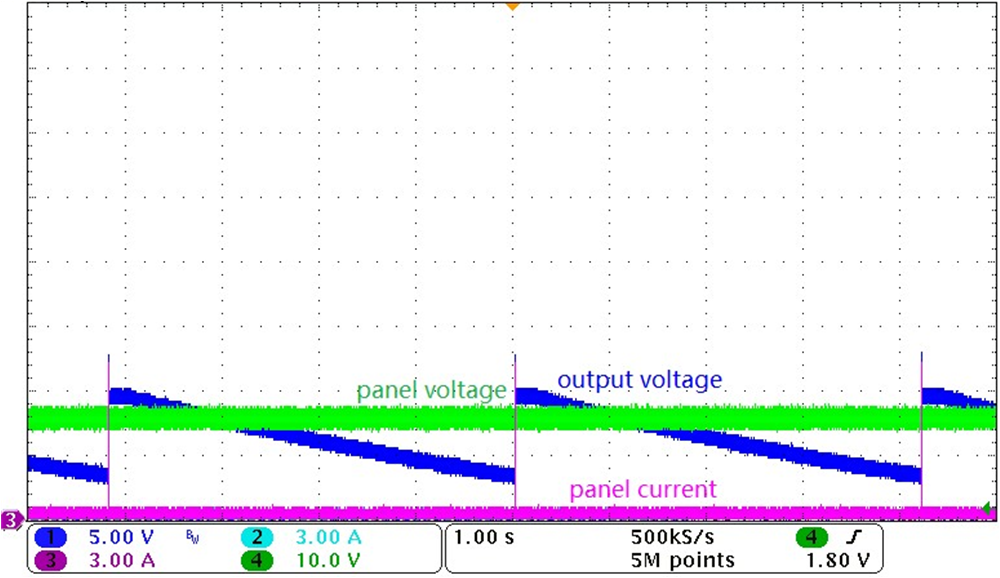
Figure 3-10 shows the system periodically goes into wait state when the battery current is lower than the limitation value (tested with the electronic load turned off). Input current is almost zero which means the output current is also almost zero, after some cycles of judgement, the system goes into wait state, no PWM is sent by the MCU and output voltage drops.
 Figure 3-10 System Current and Voltage When in Wait Mode