TIDUEM7A April 2019 – February 2021
- Description
- Resources
- Features
- Applications
- 5
- 1System Description
-
2System Overview
- 2.1 Block Diagram
- 2.2 Highlighted Products
- 2.3 Design Considerations
- 2.4
Hardware, Software, Testing Requirements, and Test Results
- 2.4.1 Required Hardware and Software
- 2.4.2
Testing and Results
- 2.4.2.1 Test Setup
- 2.4.2.2 Test Results
- 3Design Files
- 4Related Documentation
- 5About the Author
- 6Revision History
2.4.2.1.4.1 Viewing Results From LCD
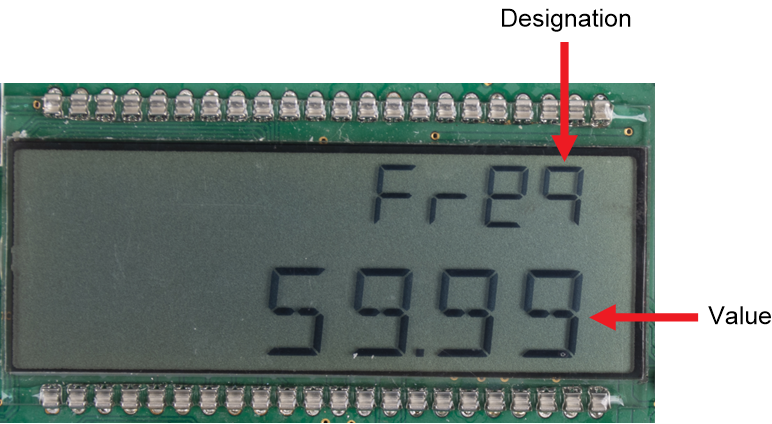
The bottom line of the LCD is used to denote the value of the parameter being displayed. The text to denote the parameter being shown displays on the top line of the LCD. Table 2-3 shows the different metering parameters that are displayed on the LCD and the associated units in which they are displayed. The designation column shows which characters correspond to which metering parameter.
Table 2-3 Displayed Parameters
| PARAMETER NAME | DESIGNATION | UNITS |
|---|---|---|
| Active power |  | Watt (W) |
| Reactive power |  | Volt-Ampere Reactive (var) |
| Apparent power |  | Volt-Ampere (VA) |
| Power factor |  | Constant between 0 and 1 |
| Voltage |  | Volts (V) |
| Current |  | Amps (A) |
| Frequency |  | Hertz (Hz) |
| Total consumed active energy |  | kWh |
| Total consumed reactive energy |  | kVarh |
| Time |  | Hour:minute:second |
| Date |  | Year:month:day |
Figure 2-29 shows an example of the measured frequency of 59.99 Hz displayed on the LCD.
 Figure 2-29 LCD