TIDUEM7A April   2019  – February 2021


  1.   Description
  2.   Resources
  3.   Features
  4.   Applications
  5.   5
  6. 1System Description
    1. 1.1 End Equipment
      1. 1.1.1 Electricity Meter
    2. 1.2 Key System Specifications
  7. 2System Overview
    1. 2.1 Block Diagram
    2. 2.2 Highlighted Products
      1. 2.2.1 ADS131M04
      2. 2.2.2 TPS7A78
      3. 2.2.3 MSP432P4111
      4. 2.2.4 TPS3840
      5. 2.2.5 THVD1500
      6. 2.2.6 ISO7731B
      7. 2.2.7 TRS3232E
      8. 2.2.8 TPS709
      9. 2.2.9 ISO7720
    3. 2.3 Design Considerations
      1. 2.3.1 Design Hardware Implementation
        1. 2.3.1.1 TPS7A78 Cap-Drop Supply
        2. 2.3.1.2 TPS3840 SVS
        3. 2.3.1.3 Analog Inputs
          1. 2.3.1.3.1 Voltage Measurement Analog Front End
          2. 2.3.1.3.2 Current Measurement Analog Front End
      2. 2.3.2 Current-Detection Mode
        1. 2.3.2.1 ADS131M04 Current-Detection Procedure
        2. 2.3.2.2 Using an MCU to Trigger Current-Detection Mode
          1. 2.3.2.2.1 Using a Timer to Trigger Current-Detection Mode Regularly
          2. 2.3.2.2.2 MCU Procedure for Entering and Exiting Current-Detection Mode
        3. 2.3.2.3 How to Implement Software for Metrology Testing
          1. 2.3.2.3.1 Setup
            1. 2.3.2.3.1.1 Clock
            2. 2.3.2.3.1.2 Port Map
            3. 2.3.2.3.1.3 UART Setup for GUI Communication
            4. 2.3.2.3.1.4 Real-Time Clock (RTC)
            5. 2.3.2.3.1.5 LCD Controller
            6. 2.3.2.3.1.6 Direct Memory Access (DMA)
            7. 2.3.2.3.1.7 ADC Setup
          2. 2.3.2.3.2 Foreground Process
            1. 2.3.2.3.2.1 Formulas
          3. 2.3.2.3.3 Background Process
            1. 2.3.2.3.3.1 per_sample_dsp()
              1. 2.3.2.3.3.1.1 Voltage and Current Signals
              2. 2.3.2.3.3.1.2 Frequency Measurement and Cycle Tracking
            2. 2.3.2.3.3.2 LED Pulse Generation
            3. 2.3.2.3.3.3 Phase Compensation
    4. 2.4 Hardware, Software, Testing Requirements, and Test Results
      1. 2.4.1 Required Hardware and Software
        1. 2.4.1.1 Cautions and Warnings
        2. 2.4.1.2 Hardware
          1. 2.4.1.2.1 Connections to the Test Setup
          2. 2.4.1.2.2 Power Supply Options and Jumper Settings
        3. 2.4.1.3 Software
      2. 2.4.2 Testing and Results
        1. 2.4.2.1 Test Setup
          1. 2.4.2.1.1 SVS and Cap-Drop Functionality Testing
          2. 2.4.2.1.2 Electricity Meter Metrology Accuracy Testing
          3. 2.4.2.1.3 Current-Detection Mode Testing
          4. 2.4.2.1.4 Viewing Metrology Readings and Calibration
            1. 2.4.2.1.4.1 Viewing Results From LCD
            2. 2.4.2.1.4.2 Calibrating and Viewing Results From PC
              1. 2.4.2.1.4.2.1 Viewing Results
              2. 2.4.2.1.4.2.2 Calibration
                1. 2.4.2.1.4.2.2.1 Gain Calibration
                  1. 4.2.1.4.2.2.1.1 Voltage and Current Gain Calibration
                  2. 4.2.1.4.2.2.1.2 Active Power Gain Calibration
                2. 2.4.2.1.4.2.2.2 Offset Calibration
                3. 2.4.2.1.4.2.2.3 Phase Calibration
        2. 2.4.2.2 Test Results
          1. 2.4.2.2.1 SVS and TPS7A78 Functionality Testing Results
          2. 2.4.2.2.2 Electricity Meter Metrology Accuracy Results
          3. 2.4.2.2.3 Current-Detection Mode Results
  8. 3Design Files
    1. 3.1 Schematics
    2. 3.2 Bill of Materials
    3. 3.3 PCB Layout Recommendations
      1. 3.3.1 Layout Prints
    4. 3.4 Altium Project
    5. 3.5 Gerber Files
    6. 3.6 Assembly Drawings
  9. 4Related Documentation
    1. 4.1 Trademarks
  10. 5About the Author
  11. 6Revision History
per_sample_dsp()

Figure 2-19 shows the flow chart for the per_sample_dsp() function. The per_sample_dsp() function is used to calculate intermediate dot product results that are fed into the foreground process for the calculation of metrology readings. Both voltage and current samples are processed and accumulated in dedicated 64-bit registers. Active power and reactive power are also accumulated in 64-bit registers.
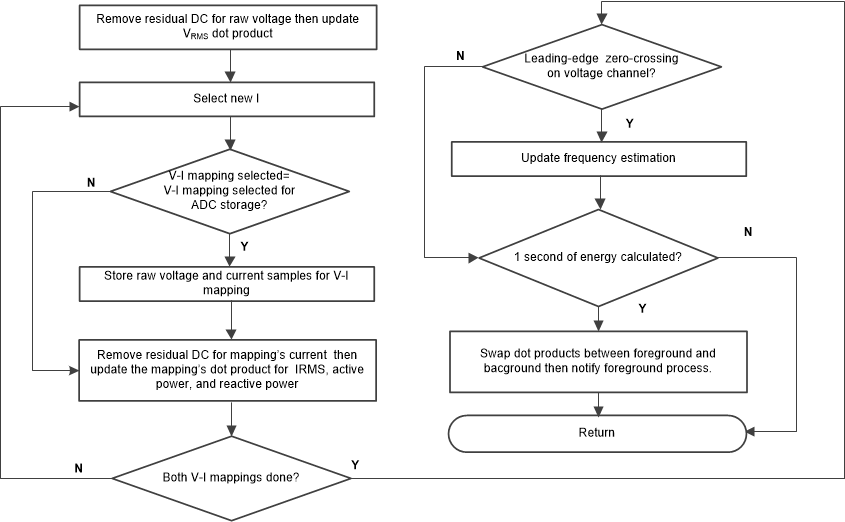
GUID-272FF30D-098D-48D4-8D81-84D597C630E1-low.gifFigure 2-19 per_sample_dsp Function

After sufficient samples (of approximately one second) are accumulated, the foreground function is triggered to calculate the final values of VRMS; IRMS; active, reactive, and apparent powers; active, reactive, and apparent energy; frequency; and power factor. In the test software, there are two sets of dot products for a phase: at any given time, one is used by the foreground for calculation and the other used as the working set by the background. After the background process has sufficient samples, it swaps the two dot products so that the foreground uses the newly-acquired dot products that the background process just calculated and the background process uses a new empty set to calculate the next set of dot products. Whenever there is a leading-edge zero-crossing (− to + voltage transition) on a voltage channel, the per_sample_dsp() function is also responsible for updating the corresponding frequency (in samples per cycle) of the phase.

The following sections describe the various elements of electricity measurement in the per_sample_dsp() function.