TIDUES5A August 2019 – September 2019
2.4.1 Correlation Based Technique for Differential TOF Estimation
The correlation based TOF estimation involves the following steps:
- A pulse train is transmitted from transducer 1 in Figure 2.
- At a certain pre-determined time, the ADC is started to capture the data at the receive transducer. Let the received data be indicated as Equation 5.

- fs = sampling rate of the ADC
- i = index of the sample
- Similarly, transmit the pulse train from transducer 2 and receive the signal at the transducer. Let the sampled signal at transducer 1 be given by Equation 6.
- Based on r1 and r2, a correlation value is calculated by Equation 7.
- k = {–m, –(m–1), ..., (m–1), m}
 for i < 1 and i > N
- The maximum of the correlation is calculated by Equation 8.
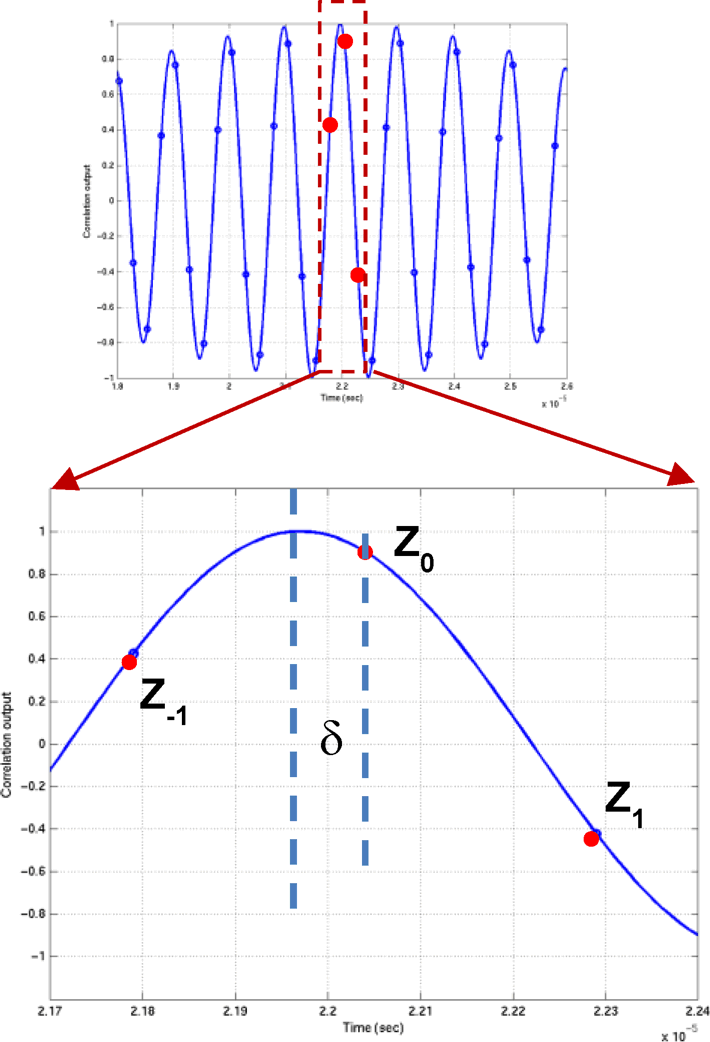
- Let Z–1 = corr(k̂–1), Z0 = corr(k̂), and Z1 = corr(k̂+1) be the values of correlation at and around the maximum.
- The real maximum of the correlation is now given by the interpolation in Equation 9.
- The net different time of flight is now given by Equation 10.
- In USS Software Library implementations, m is typically chosen to be +1, implying that only 3 correlations must be computed most of the time.
where
where

This correlation-based TOF calculation has been reported in the literature previously as given in reference [12] and reference [13]. The details of the equations for δ in Equation 10 can be found in reference [14] and provided in Section 2.4.2.1 for completeness. Figure 3 shows a block diagram of the receiver for the correlation.


Efficient interpolation techniques have been given in reference [4]. As previously mentioned, for efficiency of implementation, the correlation is computed over few points leading to a low-power implementation.
To ensure that Z0 is the maximum point, the correlation peak runs through a search algorithm sequentially computing the three adjacent correlation terms (Z–1, Z0, and Z+1) until it finds the maximum Z0 that is larger than Z–1 and Z+1 and the earlier correlation terms. Typically, only an additional 1 or 2 adjacent correlation points are computed in addition to the 3 correlation points.