TIDUET3 February   2021


  1.   1
  2.   2
  3.   3
  4.   4
  5.   5
  6.   6
    1.     7
  7.   8
    1.     9
    2.     10
    3.     11
      1.      12
      2.      13
      3.      14
      4.      15
      5.      16
      6.      17
      7.      18
      8.      19
      9.      20
    4.     21
      1.      22
        1.       23
        2.       24
        3.       25
        4.       26
        5.       27
        6.       28
        7.       29
        8.       30
      2.      31
        1.       32
        2.       33
        3.       34
        4.       35
        5.       36
        6.       37
        7.       38
        8.       39
        9.       40
        10.       41
        11.       42
        12.       43
  8.   44
    1.     45
      1.      46
    2.     47
      1.      48
        1.       49
      2.      50
        1.       51
          1.        52
          2.        53
        2.       54
          1.        55
          2.        56
          3.        57
          4.        58
          5.        59
          6.        60
          7.        61
  9.   62
    1.     63
      1.      64
      2.      65
      3.      66
      4.      67
      5.      68
    2.     69
    3.     70
    4.     71
    5.     72
  10.   73
PFC Stage Switching Waveforms

This section shows the PFC stage switching waveforms at an input voltage of 115-V AC and 230-V AC at different load conditions.

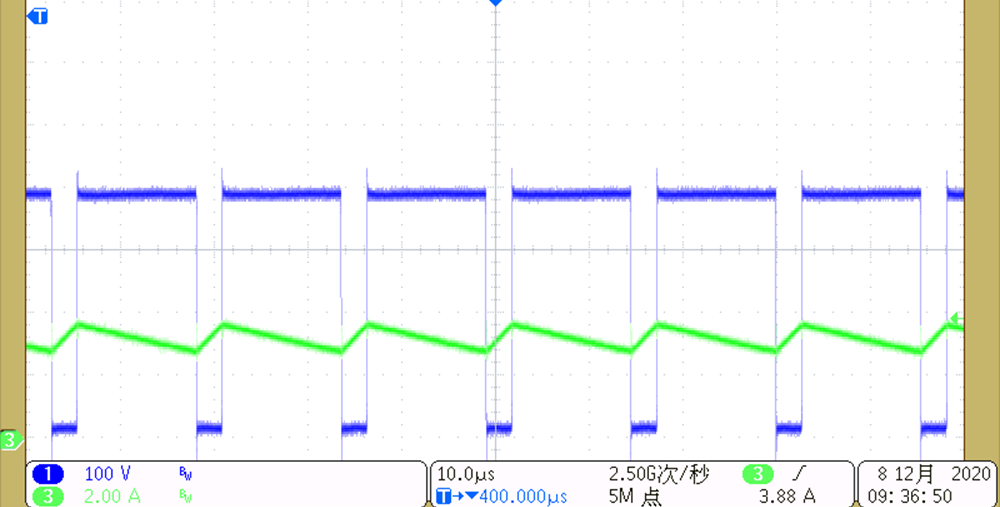
Figure 3-7 shows the PFC inductor current and switching node waveform at 230-V AC, 500 W.

GUID-20210112-CA0I-0BD7-TVQS-RZLRXNKLD2KD-low.png

Figure 3-7 PFC Inductor Current and Switching Node Waveform at 230-V AC, 500 W

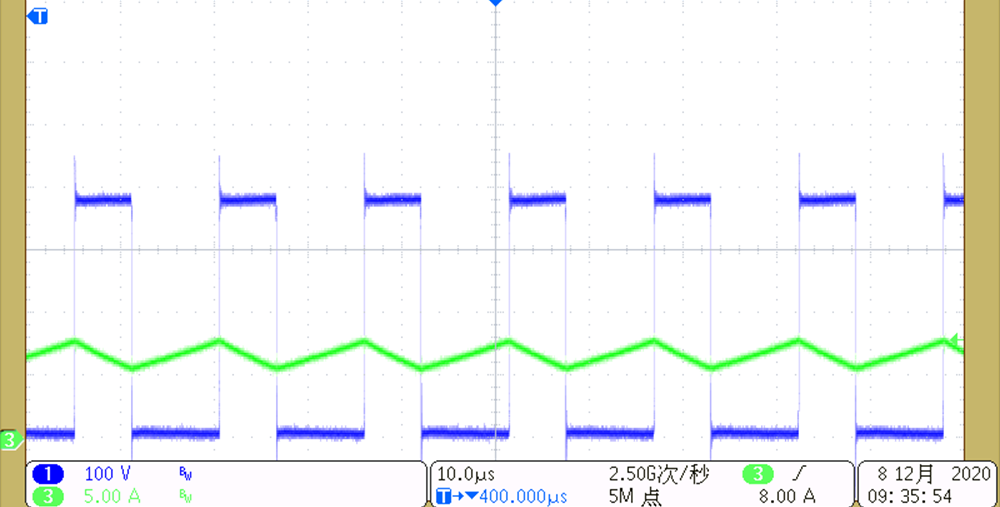
Figure 3-8 shows the PFC inductor current and switching node waveform at 115 VAC, 500 W.

GUID-20210112-CA0I-FGCD-2CRT-CCSXBGLPQW0H-low.png

Figure 3-8 PFC Inductor Current and Switching Node Waveform at 115-V AC, 500 W