TIDUEZ8C december   2022  – june 2023


  1.   1
  2.   Description
  3.   Resources
  4.   Features
  5.   Applications
  6.   6
  7. 1System Description
    1. 1.1 Insulation Monitoring
    2. 1.2 Impact of Parasitic Isolation Capacitance
    3. 1.3 IEC 61557-8 Standard for Industrial Low-Voltage Distribution Systems
    4. 1.4 Key System Specifications
  8. 2System Overview
    1. 2.1 Block Diagram
    2. 2.2 Highlighted Products
      1. 2.2.1 TPSI2140
      2. 2.2.2 AMC3330
      3. 2.2.3 TPS7A24
      4. 2.2.4 REF2033
      5. 2.2.5 TLV6001
    3. 2.3 Design Considerations
      1. 2.3.1 Resistive Bridge
      2. 2.3.2 Isolated Analog Signal Chain
        1. 2.3.2.1 Differential to Single-Ended Conversion
        2. 2.3.2.2 High-Voltage Measurement
        3. 2.3.2.3 Signal Chain Error Analysis
      3. 2.3.3 Loss of PE Detection
      4. 2.3.4 Insulation Monitoring on AC Lines
      5. 2.3.5 PCB Layout Recommendations
  9. 3Hardware, Software, Testing Requirements, and Test Results
    1. 3.1 Hardware Requirements
      1. 3.1.1 Connectors
      2. 3.1.2 Default Jumper Configuration
      3. 3.1.3 Prerequisites
    2. 3.2 Software Requirements
    3. 3.3 Software
    4. 3.4 Test Setup
    5. 3.5 Test Results
  10. 4Design and Documentation Support
    1. 4.1 Design Files
      1. 4.1.1 Schematics
      2. 4.1.2 BOM
    2. 4.2 Documentation Support
    3. 4.3 Support Resources
    4. 4.4 Trademarks
  11. 5About the Author
  12. 6Revision History

Insulation Monitoring on AC Lines

Since this reference design is capable of doing a measurement in less than 2 ms, the design is capable of measuring insulation resistance on 50-Hz and 60-Hz AC signals as well. In this case, begin the measurement close to the maximum of a sinusoidal voltage as shown in Figure 2-14. Continuously measuring the AC line voltage and setting a trigger to start the insulation monitoring measurement at, for example, 95% of the known peak voltage of the AC line leads to an accurate result, since the voltage is close to the maximum. Figure 2-14 shows the AC line voltage in green and in the two measurement periods necessary for the insulation monitoring are indicated by a high level on the yellow waveform.
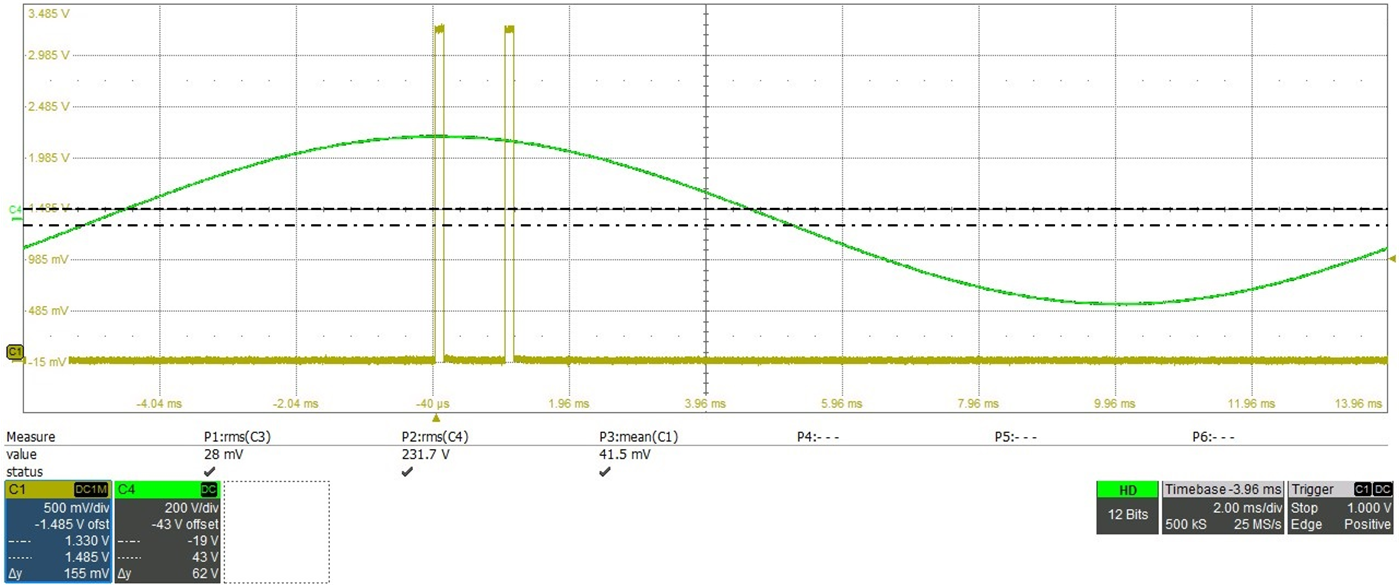
GUID-20220929-SS0I-9MJF-NXT1-G998QVWPHZDV-low.png Figure 2-14 Insulation Monitoring on AC Lines

To get accurate results, the parasitic capacitance between L1 and PE or N and PE must be below 5 nF.