TIDUF18A October 2022 – February 2024
- 1
- Description
- Resources
- Features
- Applications
- 6
- 1 CLLLC System Description
- 2 CLLLC System Overview
- 3 Totem Pole PFC System Description
- 4 Highlighted Products
-
5 Hardware, Software, Testing Requirements, and Test Results
- 5.1 Required Hardware and Software
- 5.2
Testing and Results
- 5.2.1 Test Setup (Initial)
- 5.2.2
CLLLC Test Procedure
- 5.2.2.1 Lab 1. Primary to Secondary Power Flow, Open Loop Check PWM Driver
- 5.2.2.2
Lab 2. Primary to Secondary Power Flow, Open Loop CheckPWM
Driver and ADC with Protection, Resistive Load Connected on Secondary
- 5.2.2.2.1 Setting Software Options for Lab 2
- 5.2.2.2.2 Building and Loading the Project and Setting up Debug Environment
- 5.2.2.2.3 Using Real-time Emulation
- 5.2.2.2.4 Running the Code
- 5.2.2.2.5 Measure SFRA Plant for Voltage Loop
- 5.2.2.2.6 Verify Active Synchronous Rectification
- 5.2.2.2.7 Measure SFRA Plant for Current Loop
- 5.2.2.3 Lab 3. Primary to Secondary Power Flow, Closed Voltage Loop Check, With Resistive Load Connected on Secondary
- 5.2.2.4 Lab 4. Primary to Secondary Power Flow, Closed Current Loop Check, With Resistive Load Connected on Secondary
- 5.2.2.5 Lab 5. Primary to Secondary Power Flow, Closed Current Loop Check, With Resistive Load Connected on Secondary in Parallel to a Voltage Source to Emulate a Battery Connection on Secondary Side
- 5.2.3 TTPLPFC Test procedure
- 5.2.4 Test Results
- 6 Design Files
- 7 Software Files
- 8 Related Documentation
- 9 Terminology
- 10About the Author
- 11Revision History
5.2.3.2.3 Building and Loading Project and Setting Up Debug
Right-click on the project name, and click Rebuild Project. The project builds successfully. Click Run → Debug, which launches a debugging session. In the case of dual CPU devices, a window may appear to select the CPU the debug must be performed. In this case, select CPU1. The project then loads on the device, and CCS debug view becomes active. The code halts at the start of the main routine.
To add the variables in the watch and expressions
window, click View → Scripting Console to open the scripting console
dialog box. On the upper-right corner of this console, click on Open to
browse to the setupdebugenv_lab2.js script file, which is located inside the
project folder. This file populates the watch window with appropriate variables
required to debug the system. Click on Continuous Refresh button ( ) on the watch window to
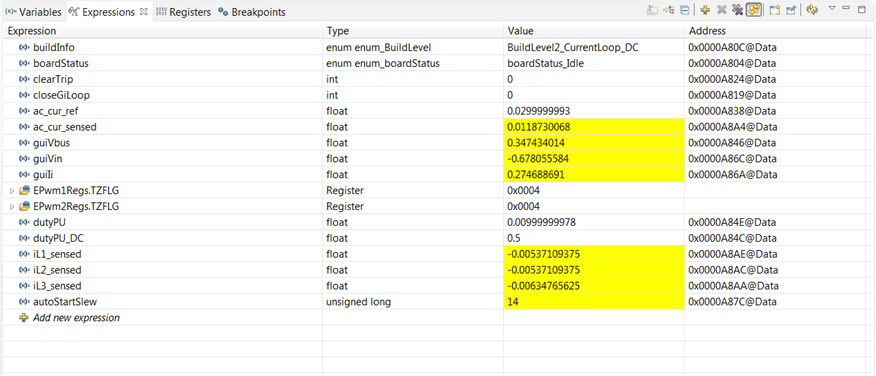
enable continuous update of values from the controller. The watch window appears as
Figure 5-34.
 Figure 5-34 Build Level 2: Closed Current Loop Expressions View
Enable real-time mode by hovering the mouse on the buttons on the horizontal toolbar and clicking the  button.
Run the project by clicking on  .
.
Halt the processor by using the Halt button on the toolbar .
.