TIDUF18A October 2022 – February 2024
- 1
- Description
- Resources
- Features
- Applications
- 6
- 1 CLLLC System Description
- 2 CLLLC System Overview
- 3 Totem Pole PFC System Description
- 4 Highlighted Products
-
5 Hardware, Software, Testing Requirements, and Test Results
- 5.1 Required Hardware and Software
- 5.2
Testing and Results
- 5.2.1 Test Setup (Initial)
- 5.2.2
CLLLC Test Procedure
- 5.2.2.1 Lab 1. Primary to Secondary Power Flow, Open Loop Check PWM Driver
- 5.2.2.2
Lab 2. Primary to Secondary Power Flow, Open Loop CheckPWM
Driver and ADC with Protection, Resistive Load Connected on Secondary
- 5.2.2.2.1 Setting Software Options for Lab 2
- 5.2.2.2.2 Building and Loading the Project and Setting up Debug Environment
- 5.2.2.2.3 Using Real-time Emulation
- 5.2.2.2.4 Running the Code
- 5.2.2.2.5 Measure SFRA Plant for Voltage Loop
- 5.2.2.2.6 Verify Active Synchronous Rectification
- 5.2.2.2.7 Measure SFRA Plant for Current Loop
- 5.2.2.3 Lab 3. Primary to Secondary Power Flow, Closed Voltage Loop Check, With Resistive Load Connected on Secondary
- 5.2.2.4 Lab 4. Primary to Secondary Power Flow, Closed Current Loop Check, With Resistive Load Connected on Secondary
- 5.2.2.5 Lab 5. Primary to Secondary Power Flow, Closed Current Loop Check, With Resistive Load Connected on Secondary in Parallel to a Voltage Source to Emulate a Battery Connection on Secondary Side
- 5.2.3 TTPLPFC Test procedure
- 5.2.4 Test Results
- 6 Design Files
- 7 Software Files
- 8 Related Documentation
- 9 Terminology
- 10About the Author
- 11Revision History
5.2.2.2.2 Building and Loading the Project and Setting up Debug Environment
- Right-click on the project name and click Rebuild Project.
- The project will build successfully.
- In the Project Explorer, make sure the correct target configuration file is set as Active under targetConfigs (see Figure 5-5).
- Then, click Run → Debug to launch a debugging session. In case of dual-CPU devices, a window might appear for the user to select the CPU on which the debug is to be performed. In this case, select CPU1.
- The project will then load on the device and the CCS debug view will become active. The code will halt at the start of the main routine.
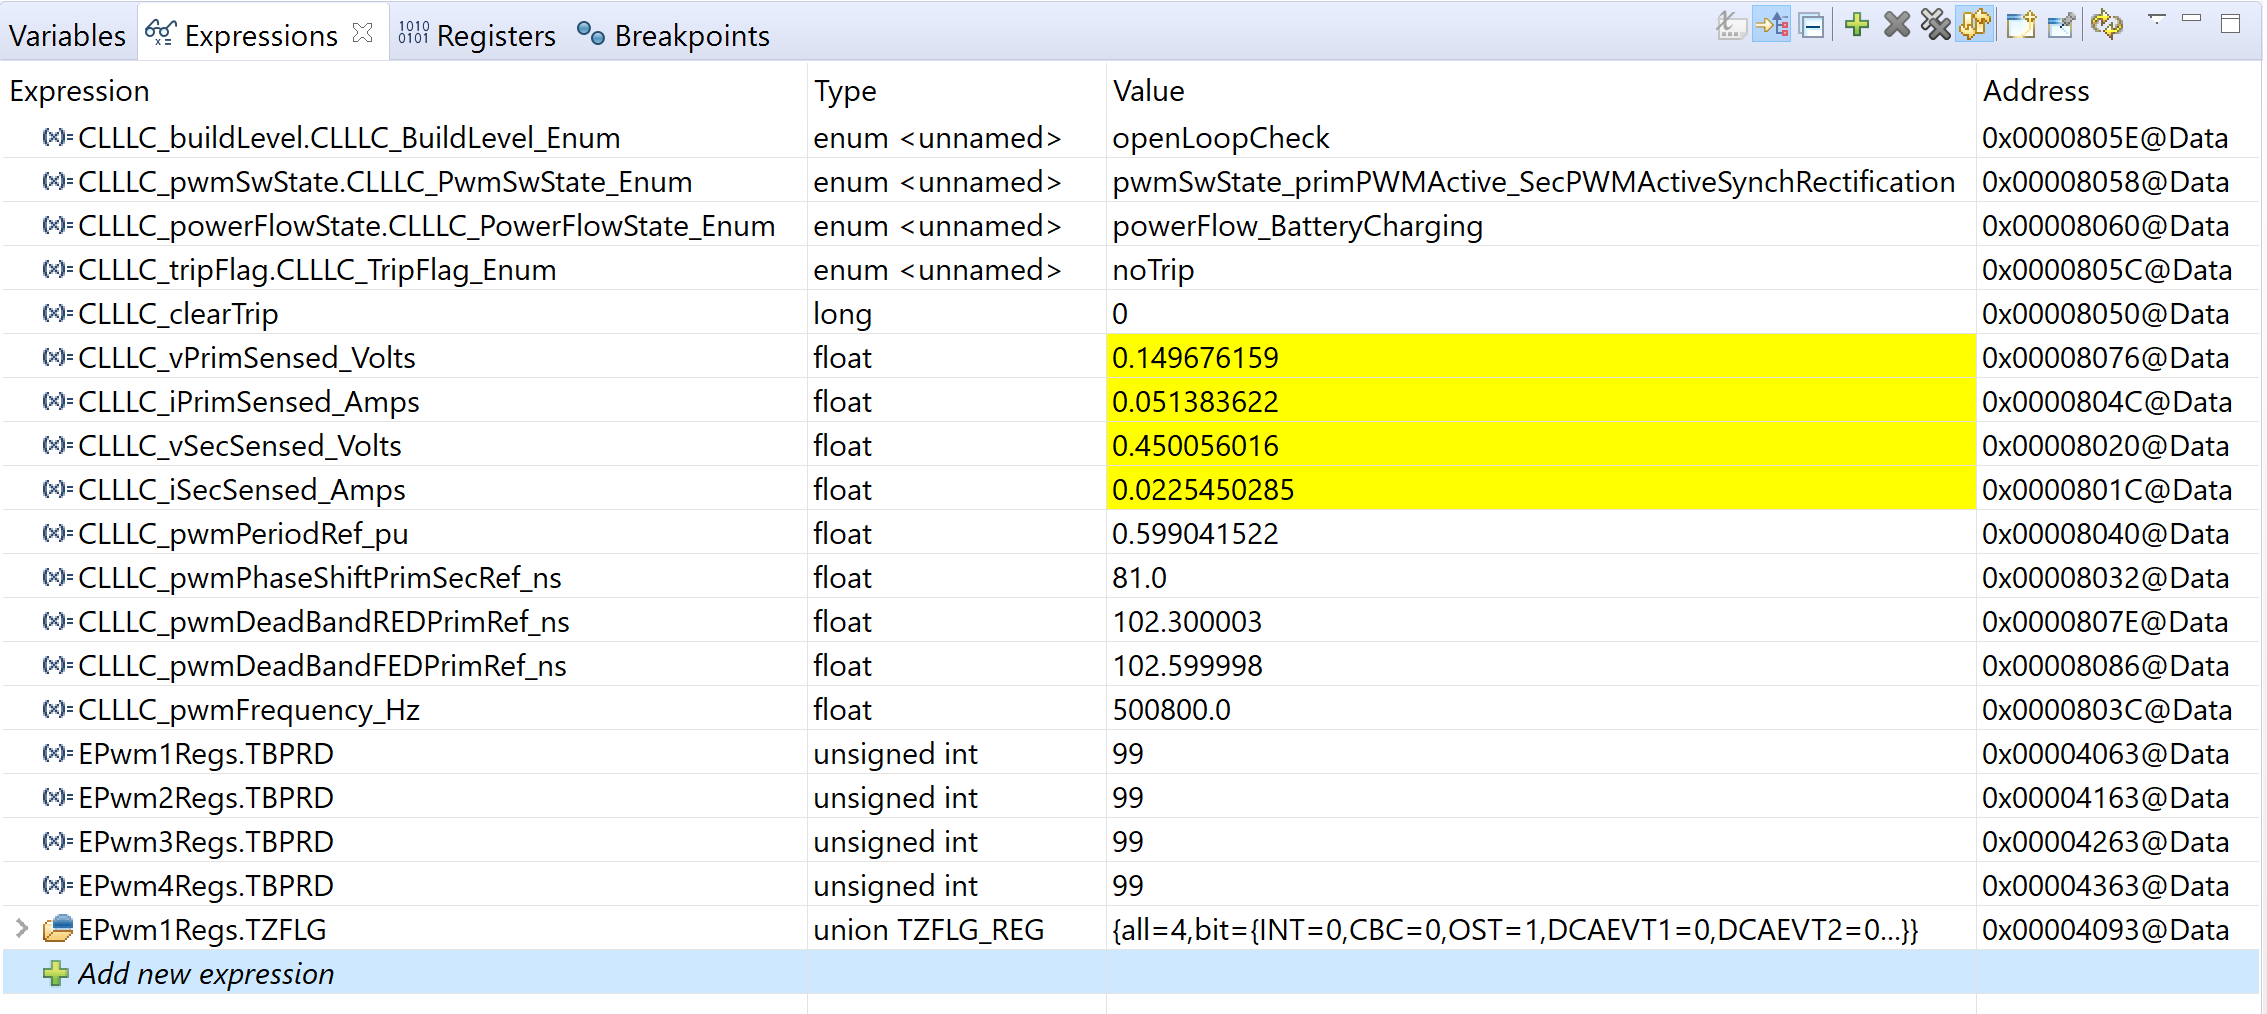
- To add the variables in the watch/expressions window, click View → Scripting Console to open the scripting console dialog box. On the upper right corner of this console, click on open and then browse to the setupdebugenv_lab2and7.js script file located inside the project folder. This will populate the watch window with the appropriate variables needed to debug the system.
- Click the Continuous Refresh button
 on the watch window to
enable continuous update of values from the controller. The watch window appears
as shown in Figure 5-9.
 Figure 5-9 Lab 2 Expression Window