TIDUF41A October 2023 – June 2024
3.3.4 TCD_PHYL_INTF_ISIRD
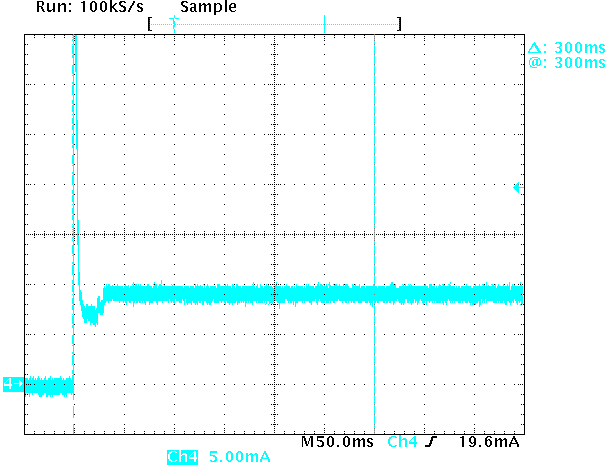
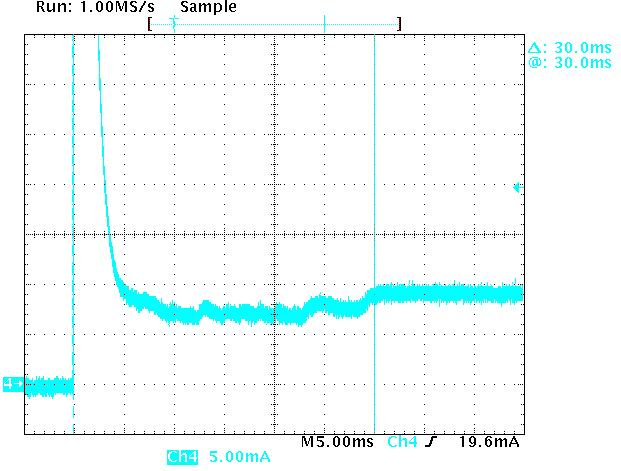
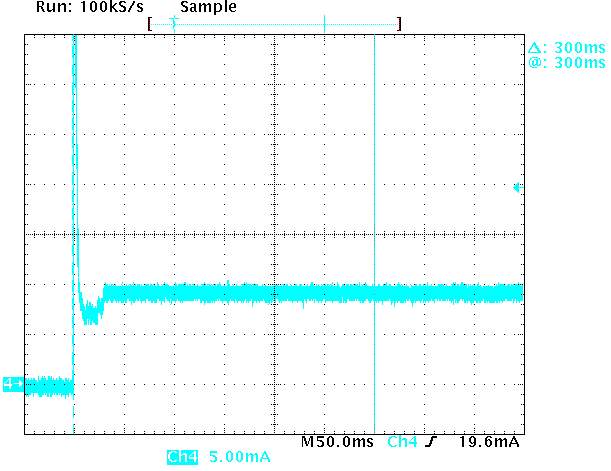
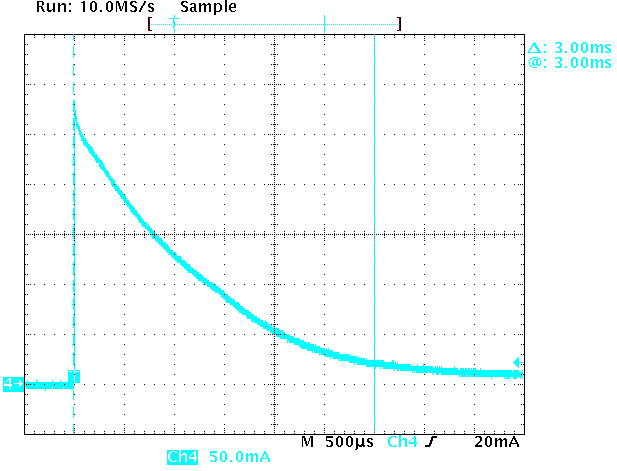
The inrush current is measured using a current clamp, the detailed waveforms are shown in Figure 3-21 through Figure 3-24. After a first high inrush current, the current is steady short below 10mA. The following scope shots show the current during the first 300ms. The charge going into the device is estimated to be below 3.5mA. The inrush current in Figure 3-21 through Figure 3-24 contains below 0.5mA, and the steady current of 10mA adds another 3mA.
 Figure 3-21 ISIRD Measurement at VSD =
18V
 Figure 3-23 ISIRD Measurement Zoomed
Into First Inrush (Note the Different Scaling)
 Figure 3-22 ISIRD Measurement at VSD =
30V
 Figure 3-24 ISIRD Measurement Zoomed
Into Inrush Current Pulse (Note the Different Scaling)