TIDUF57 November 2023
4.2 Test Setup
This section describes the test setup of the reference design board.
The AC input power goes through the power analyzer to support the reference design board. The output is taken from the USB Type-C receptacle to a USB Type-C load. The remote sense of the electronic load is connected to the output capacitor (C18) for accurate voltage measurement. See Figure 4-3for the test setup diagram.
 Figure 4-3 Test Setup Diagram
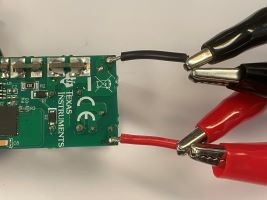
This reference design is a compact design without the use of any test points. The designer needs to connect the AC inlet on the L1 and N1 of the board close to F1 and CX1. L1 and N1 are the AC input connections and the voltage sense of power analyzer as shown in Figure 4-4. Place the voltage measurement of the power analyzer close to L1 and N1. When setting the input voltage range, check the power analyzer to get the right input voltage to reduce the effect of the AC cable drop. Read the input power with the average or integration function from the power analyzer.
 Figure 4-4 Connection of AC Input
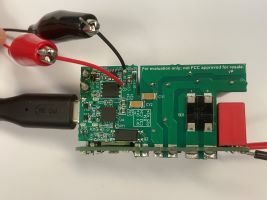
For the output, use a USB Type-C cable from J1 connected to a USB PD load board, and then to the electronic load. As shown in Figure 4-5, the remote sense is connected to the terminals of C18 to reduce the loss of the output cable drop. Read the output power from the electronic load directly.
 Figure 4-5 Remote Sense Connection for
Output