TIDUF72 August 2024
- 1
- Description
- Resources
- Features
- Applications
- 6
- 1System Description
- 2System Overview
-
3Hardware, Software, Testing Requirements, and Test Results
- 3.1
Hardware Requirements
- 3.1.1 Software Requirements
- 3.1.2 UART for PC GUI Communication
- 3.1.3 Direct Memory Access (DMA)
- 3.1.4 ADC Setup
- 3.1.5 Foreground Process
- 3.1.6 Formulas
- 3.1.7 Background Process
- 3.1.8 Software Function per_sample_dsp()
- 3.1.9 Voltage and Current Signals
- 3.1.10 Pure Waveform Samples
- 3.1.11 Frequency Measurement and Cycle Tracking
- 3.1.12 LED Pulse Generation
- 3.1.13 Phase Compensation
- 3.2
Test Setup
- 3.2.1 Power Supply Options and Jumper Setting
- 3.2.2 Electricity Meter Metrology Accuracy Testing
- 3.2.3 Viewing Metrology Readings and Calibration
- 3.2.4 Calibration and FLASH Settings for MSPM0+ MCU
- 3.2.5 Gain Calibration
- 3.2.6 Voltage and Current Gain Calibration
- 3.2.7 Active Power Gain Calibration
- 3.2.8 Offset Calibration
- 3.2.9 Phase Calibration
- 3.3 Test Results
- 3.1
Hardware Requirements
- 4Design and Documentation Support
- 5About the Authors
3.2.3.1 Calibrating and Viewing Results From PC
To view the metrology parameter values from the GUI, perform the following steps:
- Connect the reference design to a PC using an RS-232 cable. If the PC does not have an RS-232 adapter, use a serial RS-232 adapter to create a COM port on the PC when the adapter is plugged in, the default UART setting is 9600,8,n,1.
- Open the GUI folder and open calibration-config.xml in a text editor.
- Change the port name field within the
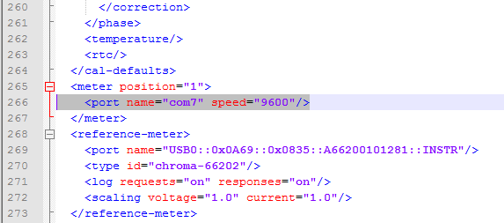
meter tag to the COM port connected to the system. As Figure 3-10 shows, this field is changed to COM7.
 Figure 3-10 GUI
Configuration File Changed to Communicate With Energy Measurement System
 - Run the calibrator.exe file, which is
located in the GUI folder. If the COM port in the calibration-config.xml was
changed in the previous step to the COM port connected to the reference design, the GUI
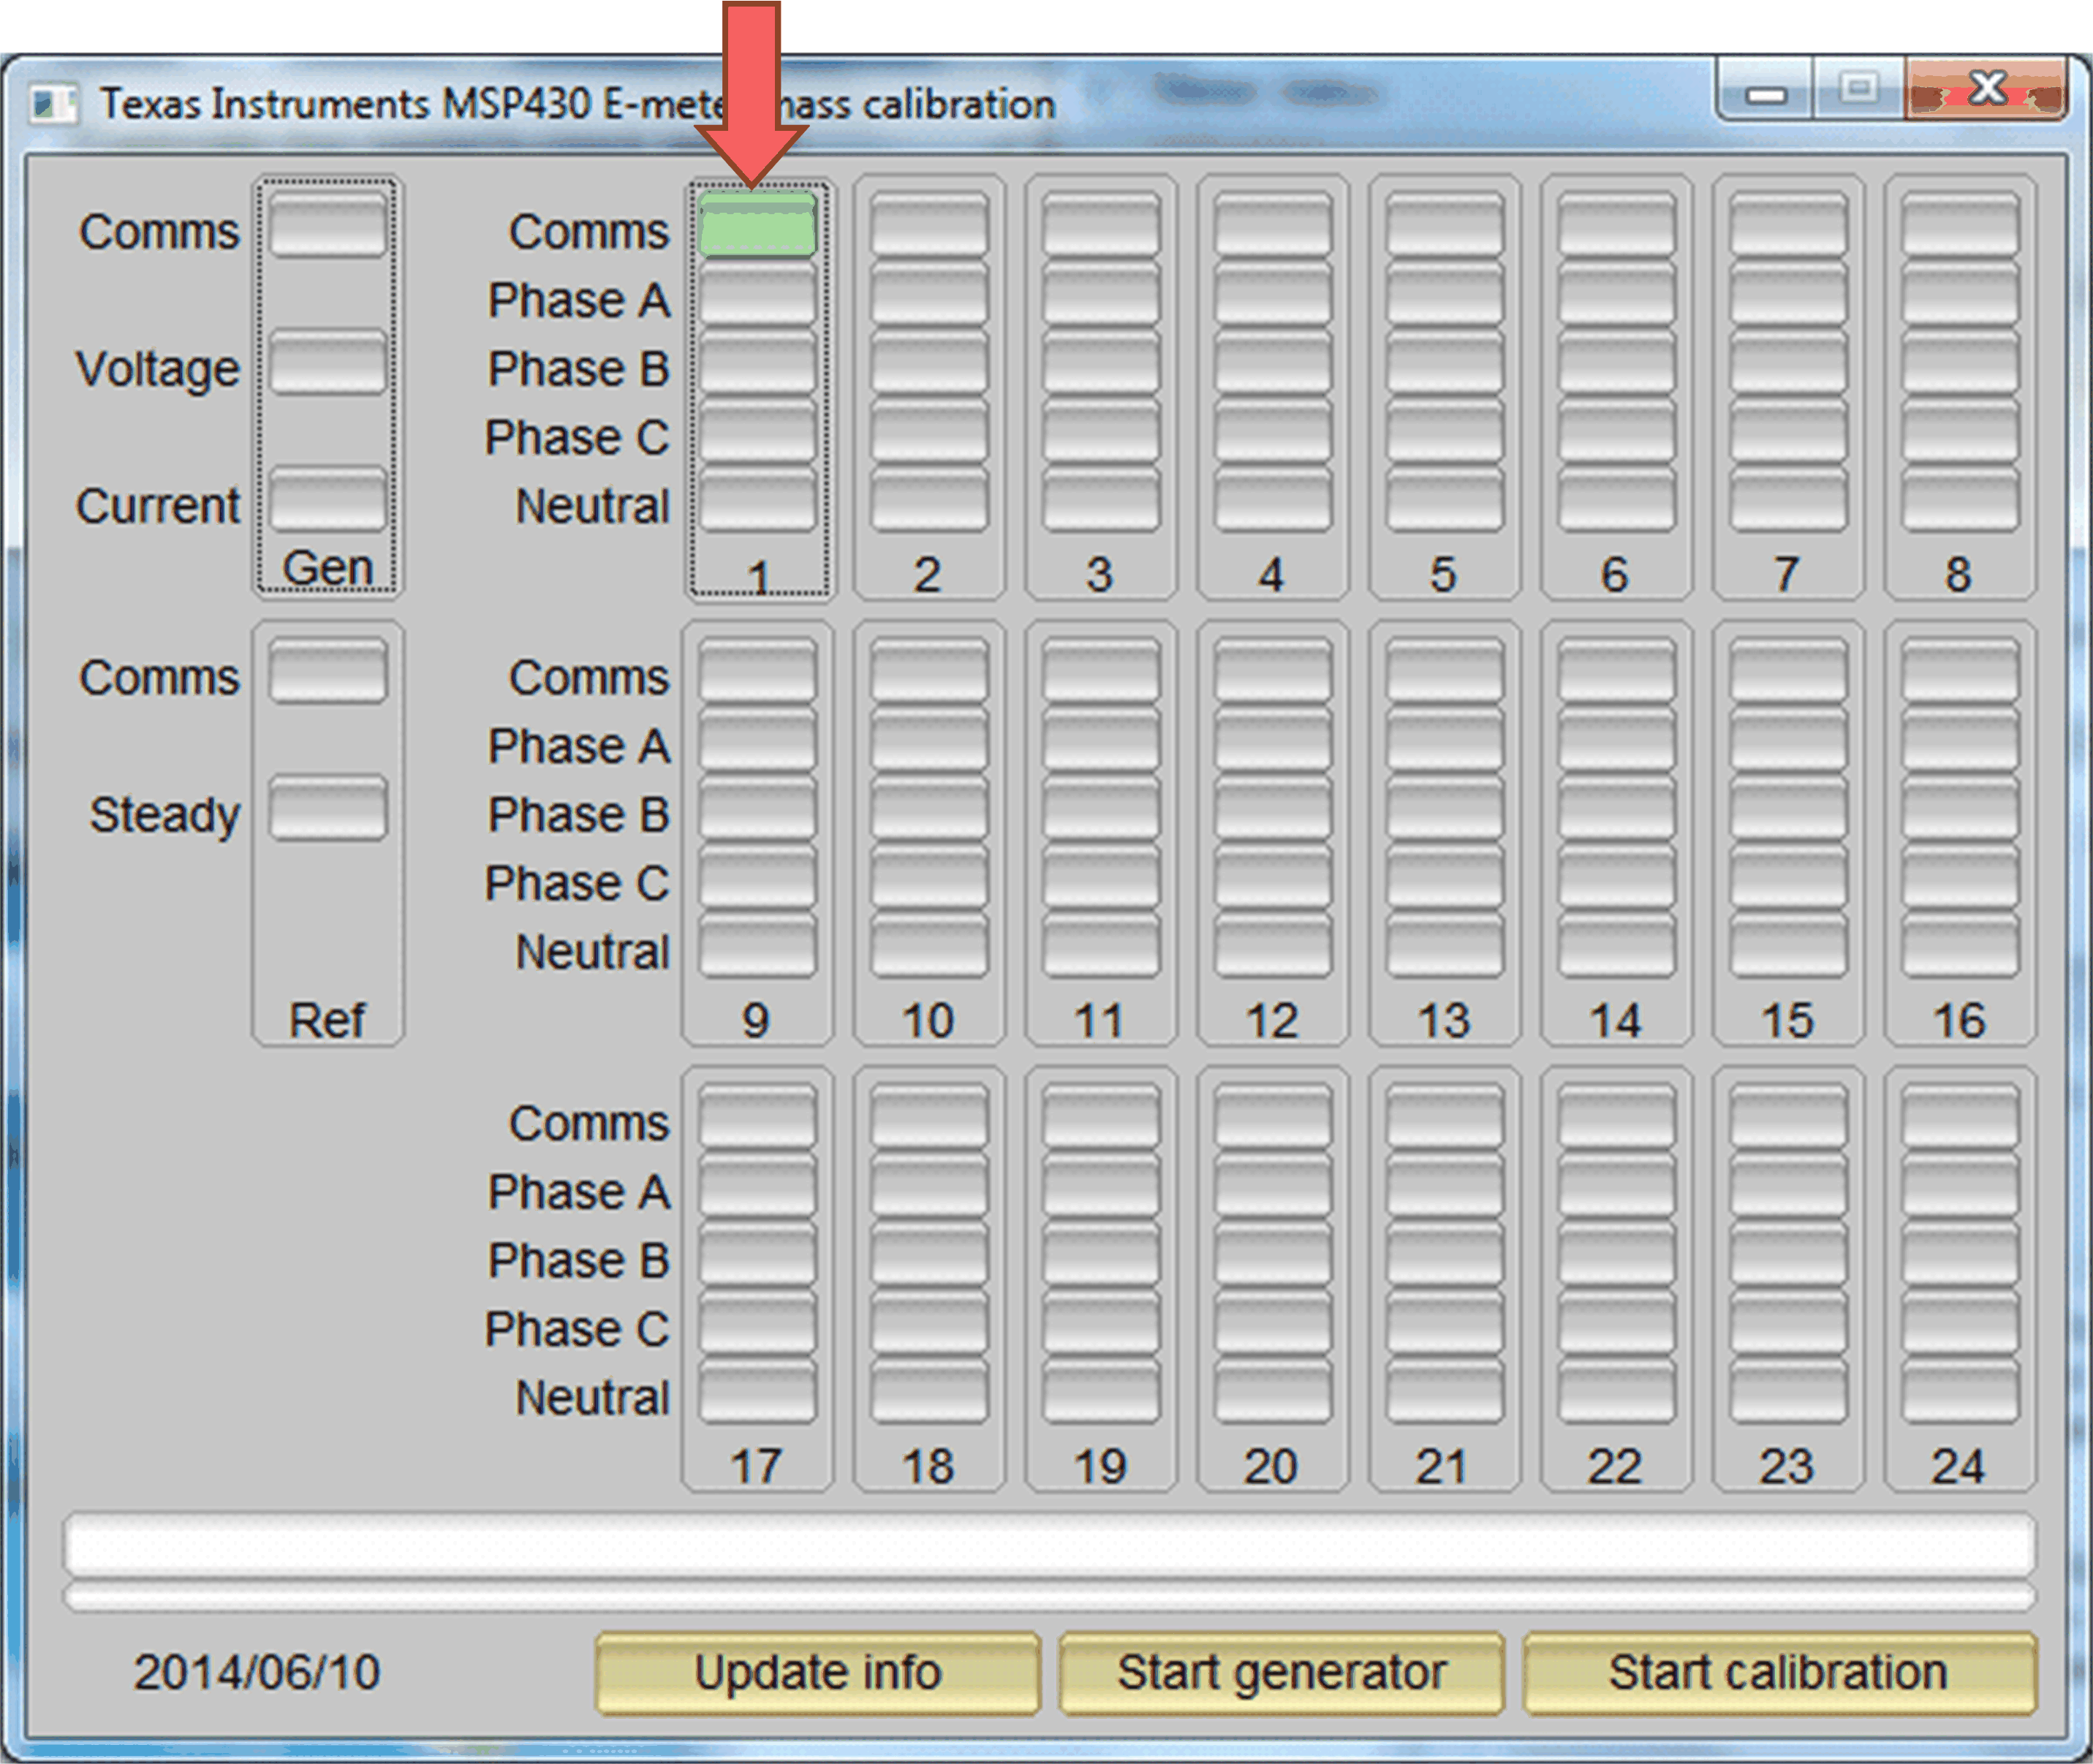
opens (see Figure 3-11). If the GUI connects to the design properly, the top-left button is green. If there
are problems with connections or if the code is not configured correctly, the button is
red. Click the green button to view the results.
 Figure 3-11 GUI Start-Up
Window
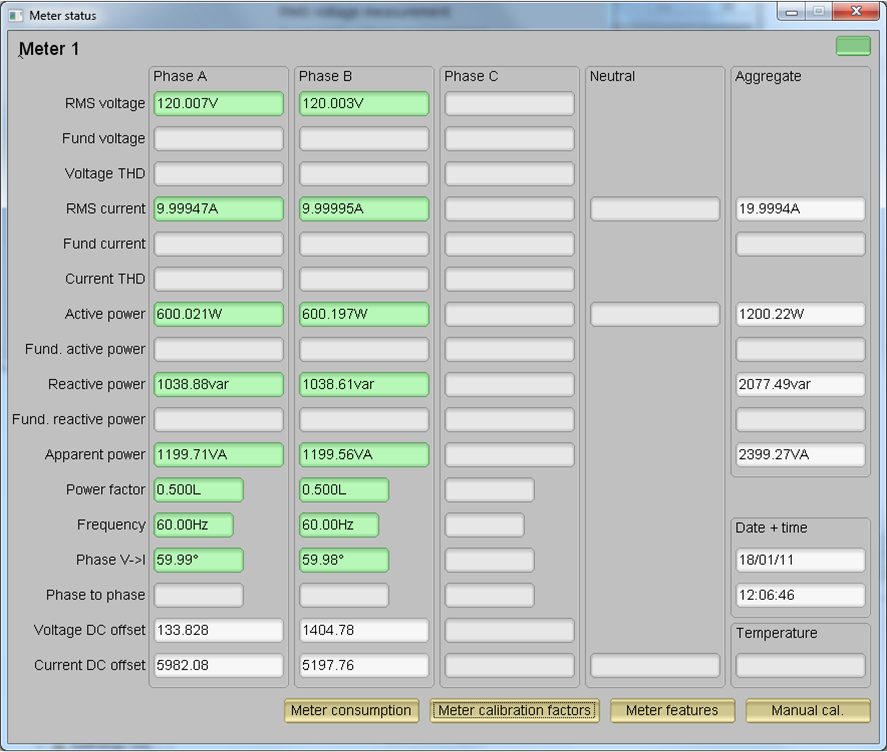
Upon clicking on the green button, the results window opens (see Figure 3-12). In the figure, there is a trailing "L" or "C" on the Power factor values to indicate an inductive or capacitive load, respectively.
 Figure 3-12 GUI Results Window
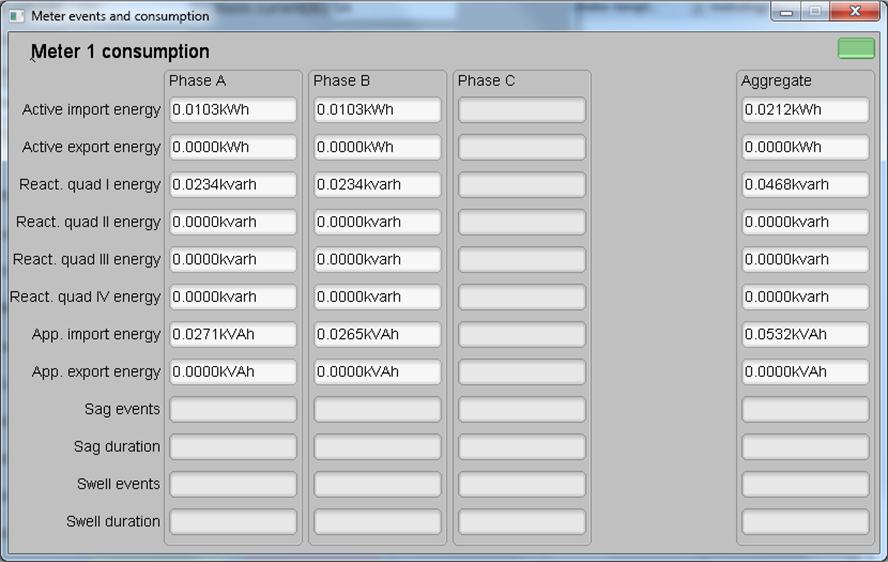
From the results window, view the total-energy consumption readings by clicking the Meter Consumption button. After the user clicks this button, the Meter events and consumption window pops up, as Figure 3-13 shows.
 Figure 3-13 Meter Events and Consumption Window
From the results window, the user can also view the meter settings by clicking the Meter features button, view the system calibration factors by clicking the Meter calibration factors button, or open the window used for calibrating the system by clicking the Manual cal. button.