TIDUF77 June 2024 – December 2024 MSPM0G1507
- 1
- Description
- Resources
- Features
- Applications
- 6
- 1System Description
-
2System Overview
- 2.1 Block Diagram
- 2.2 Design Considerations
- 2.3 Highlighted Products
- 2.4
System Design Theory
- 2.4.1
Hardware Design
- 2.4.1.1 Modular Design
- 2.4.1.2 Auxiliary Flyback Power Supply
- 2.4.1.3 DC Link Voltage Sensing
- 2.4.1.4 Inrush Current Protection
- 2.4.1.5 Motor Phase Voltage Sensing
- 2.4.1.6 Motor Phase Current Sensing
- 2.4.1.7 Over Current Protection of DRV7308
- 2.4.1.8 Internal Overcurrent Protection for TMS320F2800F137
- 2.4.2 Three-Phase PMSM Drive
- 2.4.1
Hardware Design
-
3Hardware, Software, Testing Requirements, and Test Results
- 3.1 Getting Started Hardware
- 3.2 Getting Started GUI
- 3.3
Getting Started C2000 Firmware
- 3.3.1 Download and Install Software Required for Board Test
- 3.3.2 Opening Project Inside CCS
- 3.3.3 Project Structure
- 3.3.4 Test Procedure
- 3.4
Test Results
- 3.4.1 Fast and clean Rising/Falling Edge
- 3.4.2 Inrush Current Protection
- 3.4.3 Thermal performance under 300VDC
- 3.4.4 Thermal performance under 220VAC
- 3.4.5 Overcurrent Protection by Internal CMPSS
- 3.4.6 IPM Efficiency with External Bias Supply under 300VDC
- 3.4.7 Board Efficiency with Onboard Bias Supply under 300VDC
- 3.4.8 Board Efficiency with External Bias Supply under 220VAC
- 3.4.9 Board Efficiency with Onboard Bias Supply under 220VAC
- 3.4.10 iTHD Test of Motor Phase Current
- 3.4.11 Standby Power Test
- 3.5 Migrate Firmware to a New Hardware Board
- 3.6 Getting Started MSPM0 Firmware
- 4Design and Documentation Support
- 5About the Author
3.3.4.1.3 Setup Debug Environment Windows
To watch local and global variables while debugging code is a standard debug practice. There are various methods for doing this in CCS, such as memory views and watch views. Additionally, CCS has the ability to make time (and frequency) domain plots. This ability allows the user to view waveforms using the graph tool.
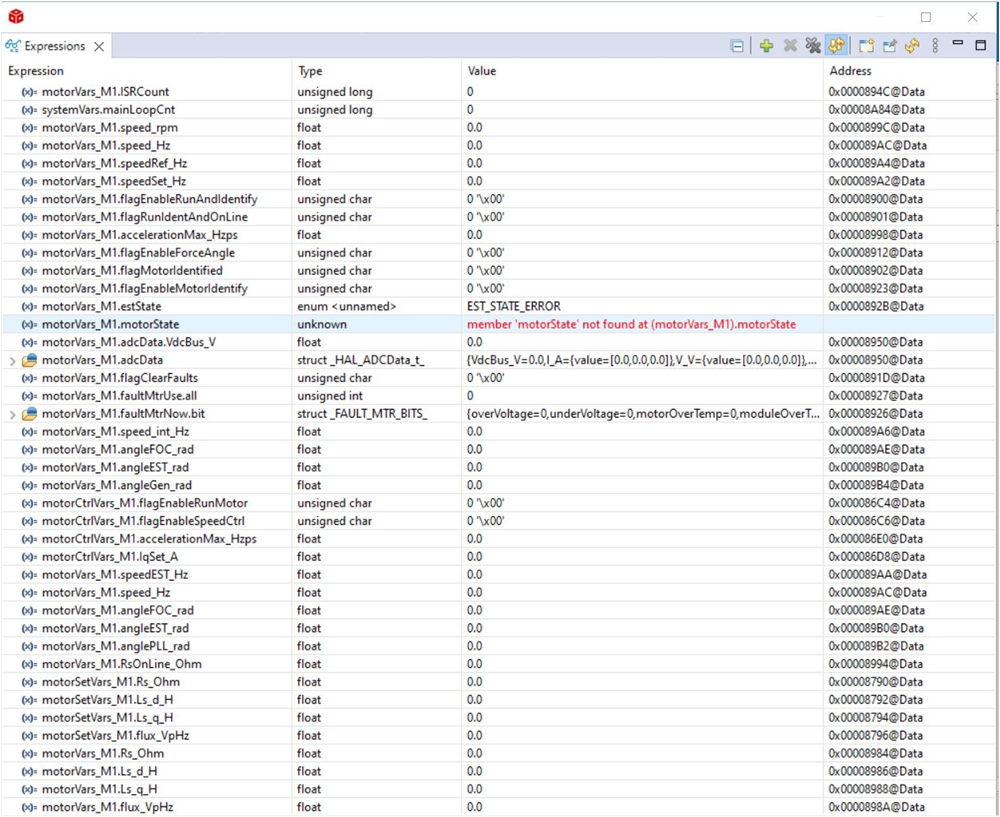
- Click View → Expressions on the menu bar to open an Expressions watch window . Move the mouse to the Expressions window to view the variables being used in the project. Add variables to the Expressions window as shown in Figure 3-24. The window uses the number format associated with variables during declaration, and Figure 3-24 shows an example of the Expressions window. Select a desired number format for the variable by right clicking on expressions and choosing.
- Alternately, a group of variables can be imported into the Expressions window by right clicking within the Expressions window and clicking Import, and browse to the directory of the project at <install_location>\solutions\tida_010273_GaNInv\src_control\common\debug and pick BuildLevel1.txt and click the OK button to import the variables shown in Figure 3-24.Note: Some of the variables have not been initialized at this point in the main code and can contain some useless values.
- The structure variables motorVars_M1[] have references to most variables that are related to controlling the motor. By expanding this variable, you can see and edit all the variables, as needed.
- Click on the Continuous Refresh button
in the expressions window. This enables the window to run with real-time mode. By clicking the down arrow in this Expressions window, you can select Customize Continuous Refresh Interval and edit the refresh rate of the expressions window. Choosing too fast an interval can affect performance.
 Figure 3-24 Build Level 1: Expressions Watch Window at Reset