TIDUF78 May 2024
4.3.1 Magnetic Z and X Field Measurement
The 2D magnetic field strength in x- and z-direction was measured at a 4kHz sample rate with the trigger mode enabled to dump 200 consecutive samples. Figure 4-6 shows the measured x- and z-axis data over the absolute linear position measured with the reference position encoder.
 Figure 4-6 Z and X Magnetic Field of the
Four TMAG5170 Versus Reference Position
Figure 4-6 Z and X Magnetic Field of the
Four TMAG5170 Versus Reference PositionWhen analyzing the captured data, we see that the X and Z component data observed by each TMAG5170 sensor overlapped. The z-axis has unipolar range and can be approximated within ±90 degree to a cosine signal with an offset equal to the amplitude. The X-axis has a bipolar amplitude, and can be approximated within ±90 degree to a sine signal. Due to that, the full-scale magnetic range for each TMAG5170 is set to ±50mT for the Z-axis and ±25mT for the x-axis.
The reason for the declining Z field amplitude from the first to the last TMAG5170 is since the TIDA-060045 PCB was not exactly mounted parallel to the mounting plate and the airgap slightly increased from the first TMAG7170 to the last. This mechanical calibration was not done.
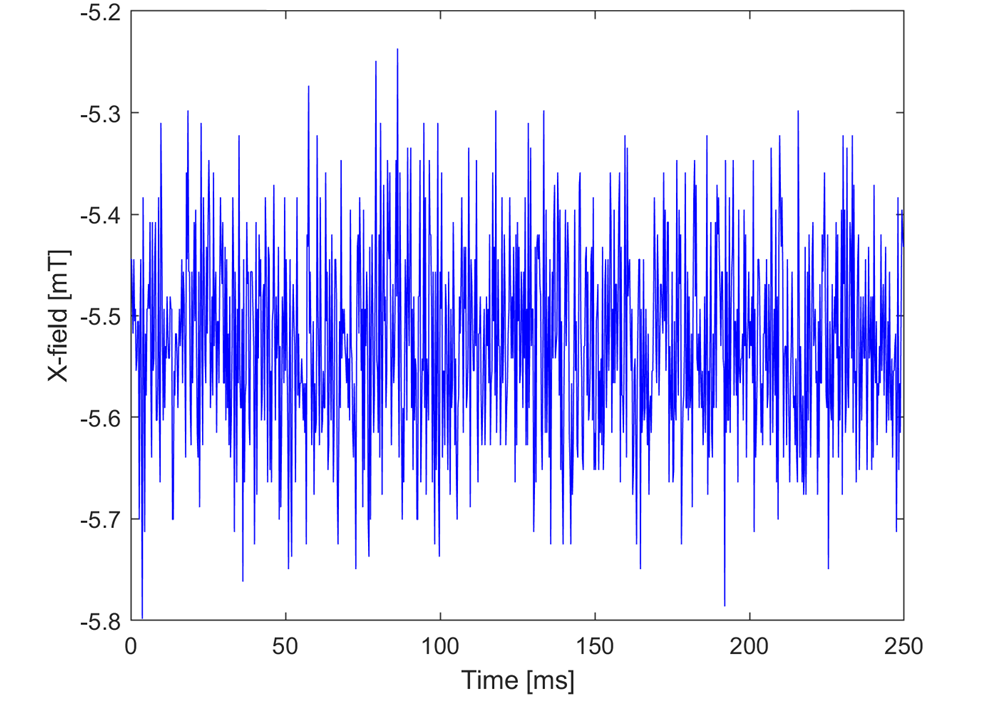
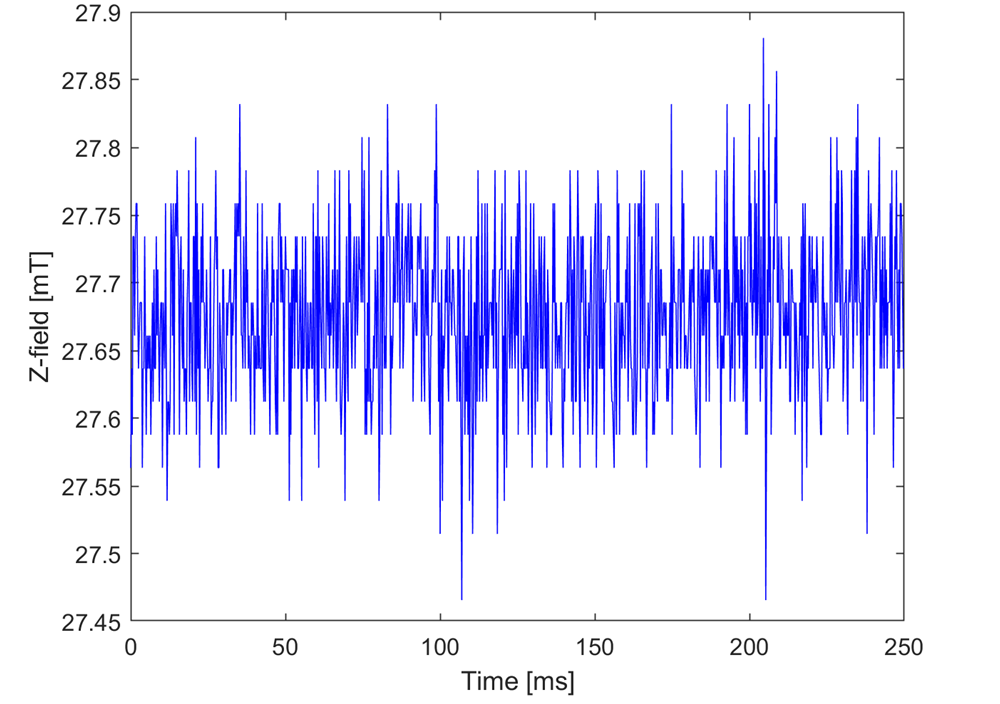
Figure 4-7 and Figure 4-8 show the time domain plot of 1000 consecutive samples of the X-field and Z-field measured with the first TMAG5170 at a 4kHz sample rate. For this test the absolute position of the sense magnet was 14.19cm.
 Figure 4-7 X-Field of First TMAG5170 at
Magnet Position 14.19cm
 Figure 4-8 Z-Field of First TMAG5170 at
Magnet Position 14.19cm
Figure 4-8 Z-Field of First TMAG5170 at
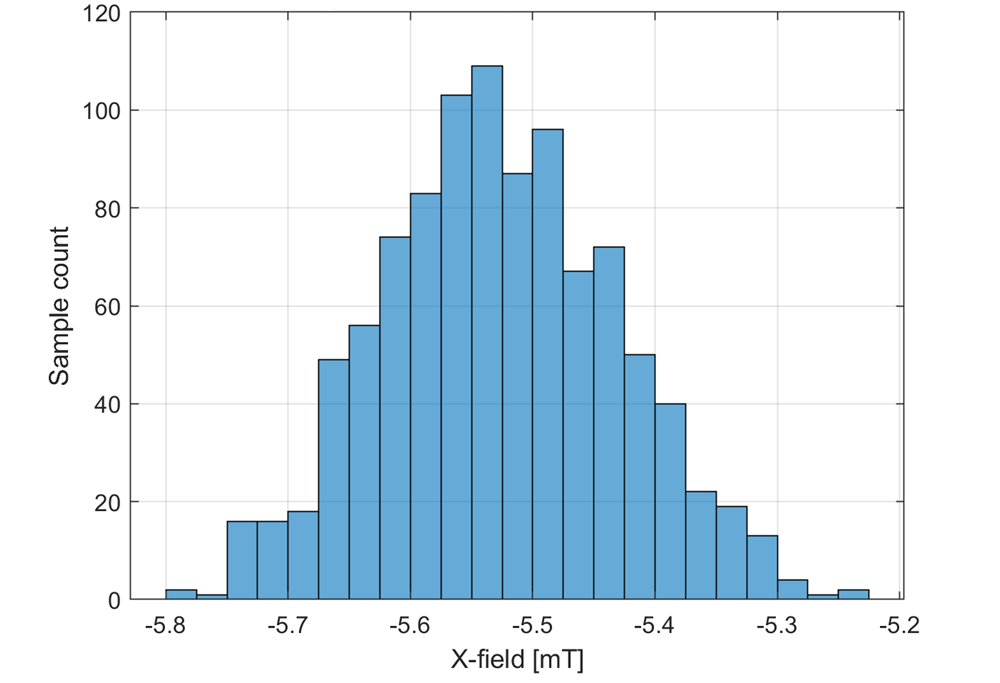
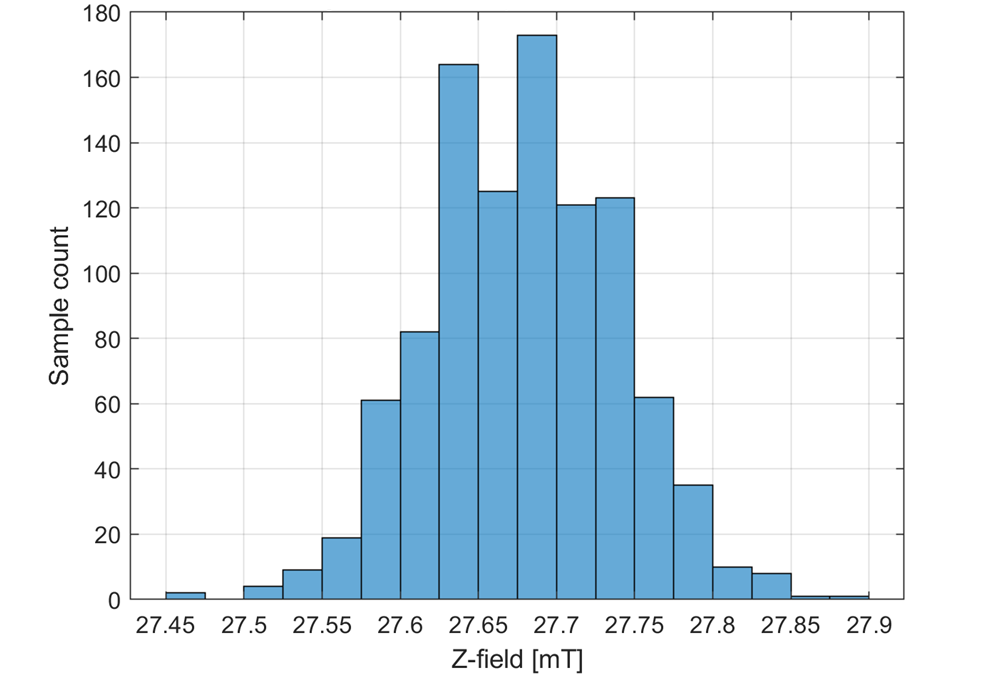
Magnet Position 14.19cmFigure 4-9 and Figure 4-10 show the corresponding histogram of the X-field and Z-field data.
 Figure 4-9 Histogram of X-Field of First
TMAG5170 at Magnet Position 14.19cm
 Figure 4-10 Histogram of Z-Field of First
TMAG5170 at Magnet Position 14.19cm
Figure 4-10 Histogram of Z-Field of First
TMAG5170 at Magnet Position 14.19cmThe standard deviation, signal-to-noise ratio (SNR) and effective number of bits (ENOB) versus full-scale range are shown in Table 4-4. The noise in the X-axis dominates due to the higher gain setting with the TMAG5170 X-axis.
| TMAG5170 | Z-AXIS | X-AXIS | COMMENT |
|---|---|---|---|
| Standard deviation [mTrms] | 0.059 | 0.094 | rms |
| Full-scale range ± [mT] | 50 | 25 | peak |
| SNR [dB] | 55.55 | 45.48 | dB |
| ENOB [bit] | 8.94 | 7.26 | Bit |