TIDUF97 September 2024
- 1
- Description
- Resources
- Features
- Applications
- 6
- 1System Description
- 2System Overview
- 3System Design Theory
- 4Hardware, Software, Testing Requirements, and Test Results
- 5Design and Documentation Support
- 6About the Authors
4.3.2 Static Angle Noise Measurement
 Figure 4-10 Static Angle at 224.8 deg Over 2000 Samples at
32kHz Sample Rate
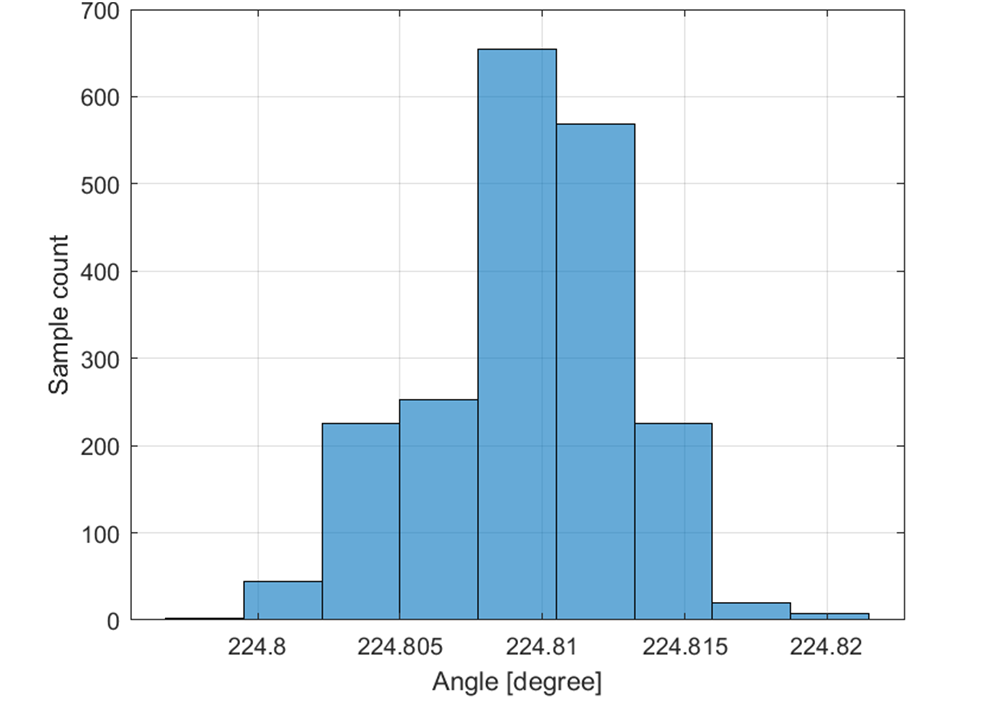
 Figure 4-11 Histogram of Angle at 224.8 deg, 2000 Samples 1LSB at 17-bit bin Width
Keep the motor shaft at fixed 224.8° mechanical angle. MSPM0 calculates angle at 32kHz. Get 2000 angle samples, plot the time-domain figure and histogram in Figure 4-10 and Figure 4-11.
The corresponding standard deviation and ENOB versus full-scale position measurement range are shown in Table 4-5. The RMS of angle noise is 0.0033°, which means 94.7dB SNR versus 360° full scale range and 15.4 ENOB.
| Parameter | Value | Comment |
|---|---|---|
| Standard deviation [°] | 0.0033 | RMS |
| Full-scale range [°] | 0-360 | |
| SNR [dB] | 94.7 | SNR=20×log10(±180 deg/STDEV) |
| ENOB [bit] | 15.4 | ENOB=(SNR-1.76)/6.02 |
Assuming uncorrelated noise, the theoretical total resolution of the absolute mechanical angle can increase by 2-bit versus the effective number of bits (ENOB) of the AMR sensors sine and cosine signal chain including the 12-bit ADC with 64-times oversampling. The theoretical resolution of the sin/cos interpolated angle over one electrical AMR sensor period equals the sine and cosine subsystem’s ENOB + 1 bit. With this design there are two electrical periods per mechanical revolution, resulting in one additional bit.
Change the motor shaft angle with 22.5° interval. Get 2000 samples at each angle, the corresponding RMS and peak to peak value is listed in Table 4-6 and Table 4-7. The peak to peak static angle noise is around 0.02° and maximum value occurs at 225°.
| Mechanical angle [°] | 0 | 22.5 | 45 | 67.5 | 90 | 112.5 | 135 | 157.5 |
|---|---|---|---|---|---|---|---|---|
| Standard deviation[°] | 0.0025 | 0.0020 | 0.0028 | 0.0027 | 0.0026 | 0.0022 | 0.0028 | 0.0028 |
| Peak to peak [°] | 0.0185 | 0.0160 | 0.0227 | 0.0185 | 0.0184 | 0.0173 | 0.0182 | 0.0192 |
| Mechanical angle [°] | 180 | 202.5 | 225 | 247.5 | 270 | 292.5 | 315 | 337.5 |
|---|---|---|---|---|---|---|---|---|
| Standard deviation [°] | 0.0029 | 0.0024 | 0.0031 | 0.0032 | 0.0026 | 0.0027 | 0.0019 | 0.0027 |
| Peak to peak [°] | 0.0182 | 0.0182 | 0.0225 | 0.0245 | 0.0184 | 0.0182 | 0.0151 | 0.0206 |
Figure 4-12 shows the peak to peak angle noise with black color with reference to the y-axis on the left over one mechanical revolution. The angle standard deviation is shown in red color with reference to x-axis in the right.
 Figure 4-12 Static Angle Noise Over One Revolution
| Mechanical angle [°] | 0 | 45 | 90 | 135 | 180 | 225 | 270 | 315 |
|---|---|---|---|---|---|---|---|---|
| Standard deviation at 0.8mm airgap [°] | 0.0031 | 0.0025 | 0.0020 | 0.0029 | 0.0027 | 0.0033 | 0.0032 | 0.0031 |
| Standard deviation at 2.3mm airgap [°] | 0.0038 | 0.0024 | 0.0035 | 0.0031 | 0.0035 | 0.0034 | 0.0034 | 0.0033 |
Change the effective air gap to 2.3mm, measure the static angle noise at different mechanical angle, the comparison test results are shown in Table 4-8. At a larger airgap, the maximum noise RMS is 0.0038° while it’s 0.0033° under 0.8mm airgap. A larger airgap can slightly increase the noise but the impact on the SNR and ENOB can be small.
 Figure 4-13 Static Angle Noise vs Airgap