Calibration of AMR Angle Sensors
Abstract
Anisotropic magneto-resistive (AMR) sensors are magnetic sensors that detect the direction of the magnetic field vector rather than the strength of the field. An AMR sensor determines the position of a rotating permanent magnet if the field is sufficiently strong. AMR sensors can typically only resolve up to 180°.
TMAG6180-Q1 and TMAG6181-Q1 both implement AMR sensing combined with a 2D Hall-effect latch to expand angle calculations to a full 360° for low-latency angle measurements. TMAG6180-Q1 produces outputs Q0 and Q1 which provides quadrature data for absolute angle measurements and TMAG6181-Q1 includes a turns counter function which tracks relative position even while operating in low power sleep mode. Understanding how to properly calibrate an end system when configuring these devices and possible sources of error is important.
Trademarks
All trademarks are the property of their respective owners.
1 Introduction
Unlike Hall-effect, Giant Magneto-Resistive (GMR), and Tunneling Magneto-Resistive elements (TMR), the Anisotropic Magneto-Resistive (AMR) sensing element does not have an output voltage proportional to the magnitude of the applied magnetic field in the direction of sensitivity. Rather, the AMR sensing element exhibits a change in resistance regarding the direction of the applied magnetic field vector.
 Figure 1-1 AMR Nominal Impedance
Alignment
 Figure 1-2 AMR Reduced Impedance
Alignment
Figure 1-2 AMR Reduced Impedance
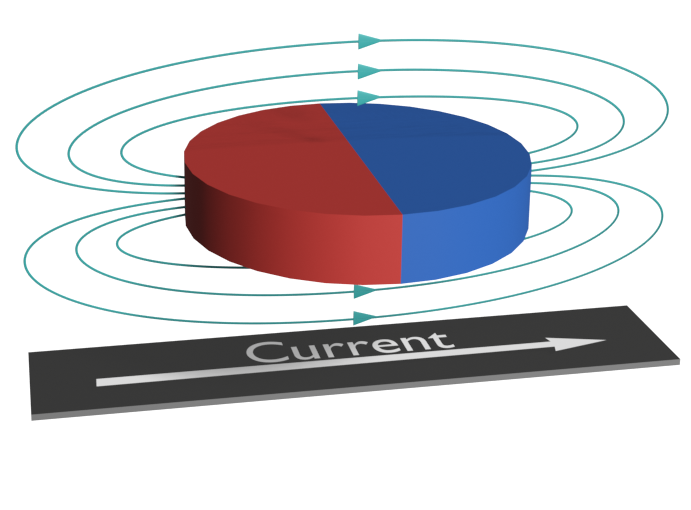
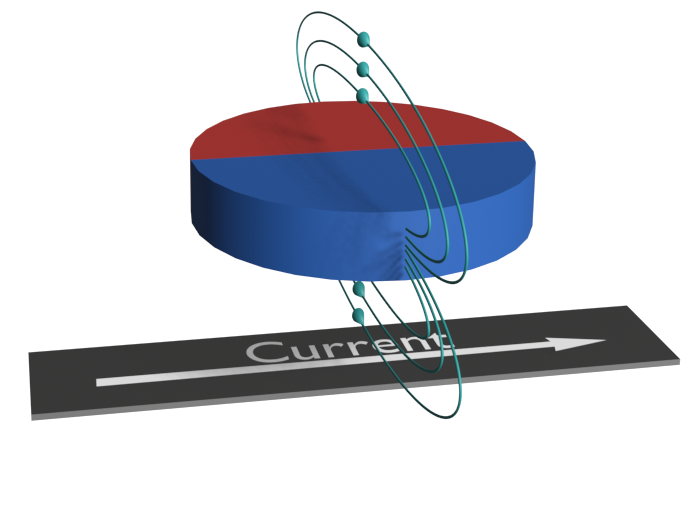
AlignmentFigure 1-1 demonstrates that there is no resulting change in impedance with the magnetic field applied parallel to the flow of current through the sensing element. However, if the applied field is orthogonal to the sensing element then the impedance varies up to a maximal saturation point (Figure 1-2).
For example, suppose that the resistive element is exposed to an oscillating magnetic field, then the resulting behavior of the AMR resistivity follows the expression in Equation 1.
 Figure 1-3 AMR Impedance vs Field Orientation
2 AMR Angle Sensing
The variation shown in Figure 1-3 is particularly helpful if the sensor is setup in the format of a Wheatstone bridge, shown in Figure 2-1. This particular configuration produces two parallel resistor dividers with elements physically orthogonal to each other. The variation in resistance results from the incident magnetic field producing a sinusoidal response as the field travels through a full rotation, balancing the structure with AMR elements with equally sized resistances along each axis.
 Figure 2-1 Wheatstone Bridge
Configuration
Figure 2-1 Wheatstone Bridge
ConfigurationWhat is particularly noteworthy about the response of the sensing element is that the output varies with cos2Ɵ. As a result, a typical AMR sensor produces two output cycles per revolution and a single Wheatstone bridge only directly resolves a physical rotation of 90°.
Given the response of the sensor to the rotating magnetic field, creating an electrically orthogonal set of sinusoidal outputs by integrating a second Wheatstone bridge rotated 45° is possible.
 Figure 2-2 Sine and Cosine Wheatstone
Arrangement
Figure 2-2 Sine and Cosine Wheatstone
ArrangementTogether, the outputs represent sine and cosine, and can then be used to calculate an arctangent with a full 360° response for every 180° of mechanical rotation.
TMAG6180-Q1 and TMAG6181-Q1 take advantage of this sensing technology by combining a fast, two-dimension, Hall-effect latch to create an AMR sensor capable of detecting quadrant and extending the sensing range from 180° to the full 360°. TMAG6180-Q1 generates Q0 and Q1 outputs which can calculate absolute angle. TMAG6181-Q1 provides a turns counter that can increment or decrement at each quadrant change. This counter tracks the relative angle from power-on and absolute angle is possible if the turns counter is always initialized within the same 180° range.
 Figure 2-3 Simulated TMAG6180 Output
Response
Figure 2-3 Simulated TMAG6180 Output
ResponseAutomatic Gain Control (AGC) in both devices is set to produce outputs with a peak to peak amplitude of 0.6 × Vcc with the output centered at Vcc/2, irrespective of the input magnetic field strength. The sensor adjusts the applied gain to maintain a constant output level following Equation 2 when changes in the magnetic field produce vector magnitude drift.
The calculated signal typically swings between ±0.6 × Vcc when measured differentially. For example, when Vcc = 3.3 V, each output signal can vary between 0.66 V and 2.64 V, and when taken differentially the resulting signal ranges between ±1.98 V.
3 Calibrating AMR
3.1 Input Related Errors
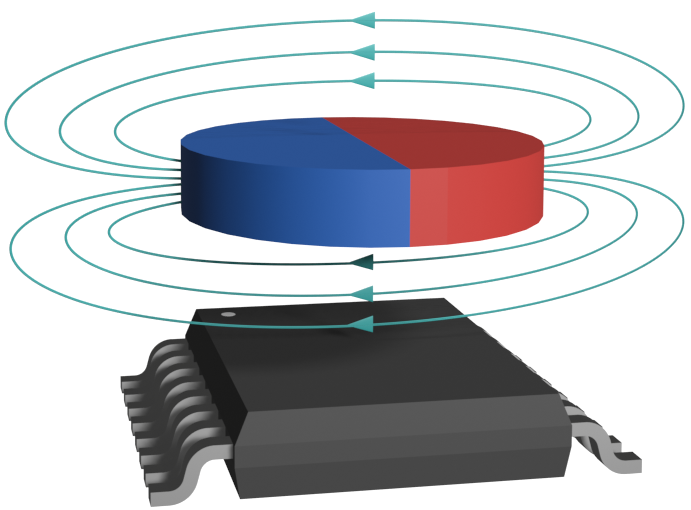
AMR angle sensors are two dimensional in design but the complete magnetic field vector is 3D. The field vector parallels the face of the magnet when a magnet is centered on the axis of rotation along the pole boundary.
 Figure 3-1 Correct Rotation
Alignment
Figure 3-1 Correct Rotation
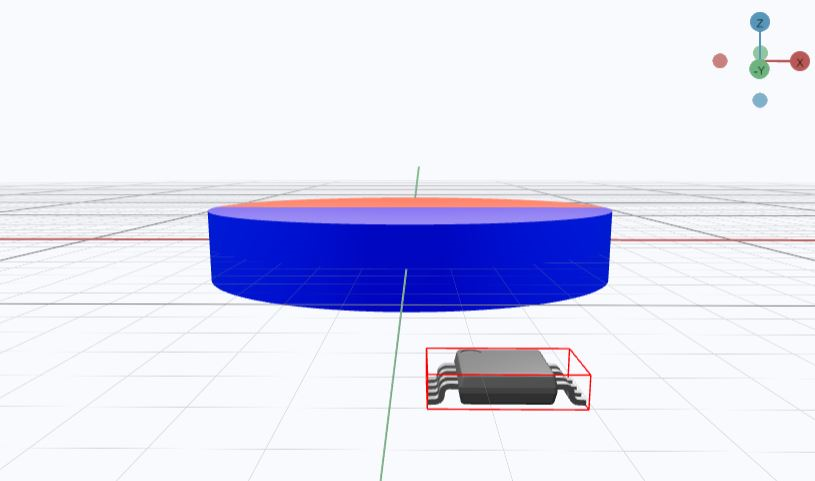
AlignmentAs a result, when the magnet rotates, the field vector is constrained in two dimensions and this produces the correct input for the sensor (Figure 3-1). The magnetic field vector varies in all three axes if the sensor is moved away from the axis of rotation.
 Figure 3-2 TMAG6180 With Mechanical
Offset
Figure 3-2 TMAG6180 With Mechanical
OffsetThe magnetic sensor is exposed to all three field components, with a circular profile presumption, but a significant portion of the input field in the z-direction is left undetected by the sensor. As a result, some input non-linearity is introduced. Consider the Lissajous plot in Figure 3-3 that uses the full vector and projection onto the XY plane when the Z component is ignored in Figure 3-4.
 Figure 3-3 3D Lissajous Plot
 Figure 3-4 2D Lissajous
Projection
Figure 3-4 2D Lissajous
ProjectionThe resulting input magnetic field angle changes at a different rate than the mechanical rotation measured because the resulting projection is elliptical instead of circular (the extremes for the X direction are ±45 mT while the Y direction is closer to 50 mT). The outputs generated by the device can take an unexpected form due to this non-linear change in angle. Careful examination of Figure 3-5 reveals that the output waveforms are slightly distorted and not demonstrating correct sine and cosine behavior.
 Figure 3-5 TMAG6180 Output Voltage with
Mechanical Offset
 Figure 3-6 Calculated Angle With
Mechanical Offset
 Figure 3-7 Angle Error Resulting From
Mechanical Offset
Figure 3-7 Angle Error Resulting From
Mechanical OffsetThe sensor outputs a non-linear angle calculation since the input to the sensor changes with a non-linear angle. This angle change is cyclical, so calibrating the sensor using techniques like multipoint linearization, a Look-up table, or harmonic approximation is available if necessary. These techniques are further described in Achieving Highest System Angle Sensing Accuracy.
3.2 Sensor Related Errors
There are four main device-level sources of error to consider with any AMR angle sensor:
- Offset
- Amplitude Mismatch
- Orthogonality Error
- Noise
These errors are better understood by comparing multiple Lissajous curves against an error-free unit circle.
 Figure 3-8 Angle Accuracy Impact Owing to
Sensor Electrical Errors, Offset Error (a), Amplitude Mismatch Error (b), and
Orthogonality Error (c)
Figure 3-8 Angle Accuracy Impact Owing to
Sensor Electrical Errors, Offset Error (a), Amplitude Mismatch Error (b), and
Orthogonality Error (c)Sections Offset, Amplitude Mismatch, and Orthogonality Error define the plot relationships of Figure 3-8. When differential outputs are available, the effective output mode can be described by Equation 3 and Equation 4. These relationships are used in subsequent calculations, but can be replaced with a single output if calculations are made with a single-ended value.