SBASAK2B march   2022  – june 2023 AFE7903

PRODUCTION DATA  

  1.   1
  2. 1Features
  3. 2Applications
  4. 3Description
  5. 4Description (continued)
  6. 5Revision History
  7. 6Specifications
    1. 6.1  Absolute Maximum Ratings
    2. 6.2  ESD Ratings
    3. 6.3  Recommended Operating Conditions
    4. 6.4  Thermal Information
    5. 6.5  Transmitter Electrical Characteristics
    6. 6.6  RF ADC Electrical Characteristics
    7. 6.7  PLL/VCO/Clock Electrical Characteristics
    8. 6.8  Digital Electrical Characteristics
    9. 6.9  Power Supply Electrical Characteristics
    10. 6.10 Timing Requirements
    11. 6.11 Switching Characteristics
    12. 6.12 Typical Characteristics
      1. 6.12.1  RX Typical Characteristics 30 MHz and 400 MHz
      2. 6.12.2  RX Typical Characteristics at 800 MHz
      3. 6.12.3  RX Typical Characteristics 1.75 GHz to 1.9 GHz
      4. 6.12.4  RX Typical Characteristics 2.6 GHz
      5. 6.12.5  RX Typical Characteristics 3.5 GHz
      6. 6.12.6  RX Typical Characteristics 4.9 GHz
      7. 6.12.7  RX Typical Characteristics 6.8 GHz
      8. 6.12.8  TX Typical Characteristics at 30 MHz and 600 MHz
      9. 6.12.9  TX Typical Characteristics at 800 MHz
      10. 6.12.10 TX Typical Characteristics at 1.8 GHz
      11. 6.12.11 TX Typical Characteristics at 2.6 GHz
      12. 6.12.12 TX Typical Characteristics at 3.5 GHz
      13. 6.12.13 TX Typical Characteristics at 4.9 GHz
      14. 6.12.14 TX Typical Characteristics at 7.1 GHz
      15. 6.12.15 PLL and Clock Typical Characteristics
  8. 7Device and Documentation Support
    1. 7.1 Receiving Notification of Documentation Updates
    2. 7.2 Support Resources
    3. 7.3 Trademarks
    4. 7.4 Electrostatic Discharge Caution
    5. 7.5 Glossary
  9. 9Mechanical, Packaging, and Orderable Information

Package Options

Mechanical Data (Package|Pins)
Thermal pad, mechanical data (Package|Pins)
Orderable Information

TX Typical Characteristics at 1.8 GHz

Typical values at TA = +25°C with nominal supplies. Unless otherwise noted, TX input data rate = 491.52 MSPS, fDAC = 11796.48MSPS, interleave mode, AOUT = –1 dBFS, 1st Nyquist zone output, Internal PLL, fREF = 491.52 MSPS, 24x Interpolation, DSA = 0 dB, Sin(x)/x enabled, DSA calibrated

GUID-1350D89B-F4B7-4090-9EC0-E9A5C31494B5-low.gif
Matching at 1.8 GHz, Single tone, fDAC = 11.79648GSPS, interleave mode, 40-MHz offset
Figure 6-353 TX Single Tone Output Noise vs Frequency and Amplitude at 1.8 GHz
GUID-20211125-SS0I-HF8G-KKGR-NDZM5HBLHBB2-low.svg
Matching at 1.8 GHz, single carrier 20-MHz BW TM1.1 LTE
Figure 6-355 TX 20-MHz LTE ACPR vs Digital Level at 1.8425 GHz
GUID-20211125-SS0I-JMDN-2M2S-MV1JVGVBJTDR-low.svg
Matching at 1.8 GHz, single carrier 20-MHz BW TM1.1 LTE
Figure 6-357 TX 20-MHz LTE alt2-ACPR vs Digital Level at 1.8425 GHz
GUID-20211125-SS0I-GC6J-6ZBB-KQBQW8FPPBLD-low.svg
Matching at 1.8 GHz, single carrier 20-MHz BW TM1.1 LTE
Figure 6-359 TX 20-MHz LTE alt-ACPR vs DSA at 1.8 GHz
GUID-20211125-SS0I-38DK-30TQ-49QLVGRSGDSH-low.svg
Matching at 1.8 GHz, fDAC = 11.79648 GSPS, interleave mode, normalized to output power at harmonic frequency
Figure 6-361 TX HD3 vs Digital Amplitude and Output Frequency at 1.8 GHz
GUID-FD5AEE82-BCEC-490C-95C3-25275DD55EFA-low.gif
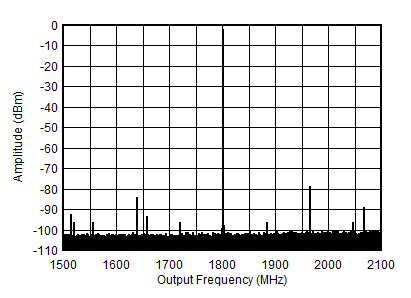
fDAC = 8847.36 MSPS, interleave mode, 1.8 GHz matching, includes PCB and cable losses
Figure 6-363 TX Single Tone (–12 dBFS) Output Spectrum at 1.8 GHz (±300 MHz)
GUID-C65F235F-6ABD-40E3-9B32-CB4266DEEF5A-low.gif
fDAC = 8847.36 MSPS, interleave mode, 1.8 GHz matching, includes PCB and cable losses
Figure 6-365 TX Single Tone (–6 dBFS) Output Spectrum at 1.8 GHz (±300 MHz)
GUID-01C055F0-F875-4DB8-8955-7E799BEBFBE8-low.gif
fDAC = 8847.36 MSPS, interleave mode, 1.8 GHz matching, includes PCB and cable losses
Figure 6-367 TX Single Tone (–1 dBFS) Output Spectrum at 1.8 GHz (±300 MHz)
GUID-CA5B0FB5-C85D-4035-9135-3A4C0B940893-low.gif
fDAC = 8847.36 MSPS, straight mode, 1.8 GHz matching, includes PCB and cable losses
Figure 6-369 TX Single Tone (–12 dBFS) Output Spectrum at 1.8 GHz (±300 MHz)
GUID-50412CE4-1C0A-4A5B-AB42-383DFCB904C7-low.gif
fDAC = 8847.36 MSPS, straight mode, 1.8 GHz matching, includes PCB and cable losses
Figure 6-371 TX Single Tone (–6 dBFS) Output Spectrum at 1.8 GHz (±300 MHz)
GUID-D1E8AD2B-49CF-4509-B9B3-9DDA605241F0-low.gif
fDAC = 8847.36 MSPS, straight mode, 1.8 GHz matching, includes PCB and cable losses
Figure 6-373 TX Single Tone (–1 dBFS) Output Spectrum at 1.8 GHz (±300 MHz)
GUID-739CF5DB-0CB9-4071-A8A9-EEA69186D61B-low.gif
TM1.1, POUT_RMS = –13 dBFS
Figure 6-354 TX 20-MHz LTE Output Spectrum at 1.8425 GHz
GUID-20211125-SS0I-J4DM-ZPG7-BKFNN68CQNFT-low.svg
Matching at 1.8 GHz, single carrier 20-MHz BW TM1.1 LTE
Figure 6-356 TX 20-MHz LTE alt-ACPR vs Digital Level at 1.8425 GHz
GUID-20211125-SS0I-JB0M-DCGH-K6BWCH4TX8FF-low.svg
Matching at 1.8 GHz, single carrier 20-MHz BW TM1.1 LTE
Figure 6-358 TX 20-MHz LTE ACPR vs DSA at 1.8 GHz
GUID-20211125-SS0I-FN7F-3T7C-VMNVWLS3G546-low.svg
Matching at 1.8 GHz, fDAC = 11.79648 GSPS, interleave mode, normalized to output power at harmonic frequency
Figure 6-360 TX HD2 vs Digital Amplitude and Output Frequency at 1.8 GHz
GUID-6548644D-CAB0-48EC-83EB-BC7C3A768A76-low.gif
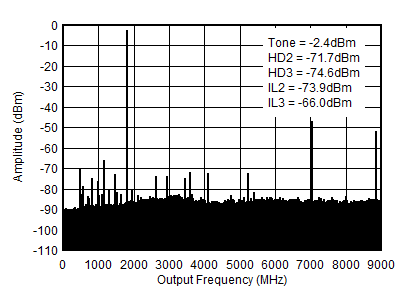
fDAC = 8847.36 MSPS, interleave mode, 1.8 GHz matching, includes PCB and cable losses. ILn = fS/n ± fOUT.
Figure 6-362 TX Single Tone (–12 dBFS) Output Spectrum at 1.8 GHz (0-fDAC)
GUID-39EAC0C6-53C8-4F89-A8E9-AE3DF7EA8BFC-low.gif
fDAC = 8847.36 MSPS, interleave mode, 1.8 GHz matching, includes PCB and cable losses. ILn = fS/n ± fOUT.
Figure 6-364 TX Single Tone (–6 dBFS) Output Spectrum at 1.8 GHz (0-fDAC)
GUID-AB019C5F-768B-440C-A8C6-EECEBBB680A8-low.gif
fDAC = 8847.36 MSPS, interleave mode, 1.8 GHz matching, includes PCB and cable losses. ILn = fS/n ± fOUT.
Figure 6-366 TX Single Tone (–1 dBFS) Output Spectrum at 1.8 GHz (0-fDAC)
GUID-8CBD8B90-4FA3-4F46-9768-111D0F57E27E-low.gif
fDAC = 8847.36 MSPS, straight mode, 1.8 GHz matching, includes PCB and cable losses. ILn = fS/n ± fOUT and is due to mixing with digital clocks.
Figure 6-368 TX Single Tone (–12 dBFS) Output Spectrum at 1.8 GHz (0-fDAC)
GUID-287556C5-5427-4442-9DC3-62688F45294C-low.gif
fDAC = 8847.36 MSPS, straight mode, 1.8 GHz matching, includes PCB and cable losses. ILn = fS/n ± fOUT and is due to mixing with digital clocks.
Figure 6-370 TX Single Tone (–6 dBFS) Output Spectrum at 1.8 GHz (0-fDAC)
GUID-C1696230-6981-4E59-838C-7D8E2020013E-low.gif
fDAC = 8847.36 MSPS, straight mode, 1.8 GHz matching, includes PCB and cable losses. ILn = fS/n ± fOUT and is due to mixing with digital clocks.
Figure 6-372 TX Single Tone (–1 dBFS) Output Spectrum at 1.8 GHz (0-fDAC)