SBAS649B June 2021 – June 2022 DAC12DL3200
PRODUCTION DATA
- 1 Features
- 2 Applications
- 3 Description
- 4 Revision History
- 5 Pin Configuration and Functions
-
6 Specifications
- 6.1 Absolute Maximum Ratings
- 6.2 ESD Ratings
- 6.3 Recommended Operating Conditions
- 6.4 Thermal Information
- 6.5 Electrical Characteristics - DC Specifications
- 6.6 Electrical Characteristics - Power Consumption
- 6.7 Electrical Characteristics - AC Specifications
- 6.8 Timing Requirements
- 6.9 Switching Characteristics
- 6.10 Typical Characteristics
-
7 Detailed Description
- 7.1 Overview
- 7.2 Functional Block Diagram
- 7.3
Feature Description
- 7.3.1 DAC Output Modes
- 7.3.2 DAC Output Interface
- 7.3.3 LVDS Interface
- 7.3.4 Multi-Device Synchronization (SYSREF+/-)
- 7.3.5 Alarms
- 7.4 Device Functional Modes
- 7.5 Programming
- 8 Application and Implementation
- 9 Device and Documentation Support
- 10Mechanical, Packaging, and Orderable Information
Package Options
Mechanical Data (Package|Pins)
Thermal pad, mechanical data (Package|Pins)
Orderable Information
6.10 Typical Characteristics
Typical values at TA =
25°C, nominal supply voltages, COARSE_CUR_A/B = 0xFF (IFS_SWITCH = 21 mA), output from VOUTA± in
single-channel modes, AOUT = 0 dBFS, fCLK = 3.2 GHz in dual
channel NRZ, RTZ and RF mode, fCLK = 6.4 GHz in dual channel 2xRF and single
channel NRZ, RTZ and RF mode, filtered, SHUNTREF_EN = 0x0FFF (unless otherwise noted);
Figure 6-1 Output Current DNL vs Code
Figure 6-3 Single Channel: Output Power vs Output Frequency and Mode
Figure 6-5 Single Channel RF Mode: Output Power vs Output Frequency
Figure 6-7 Dual
Channel Modes: DAC12DL3200EVM Output Power vs Output Frequency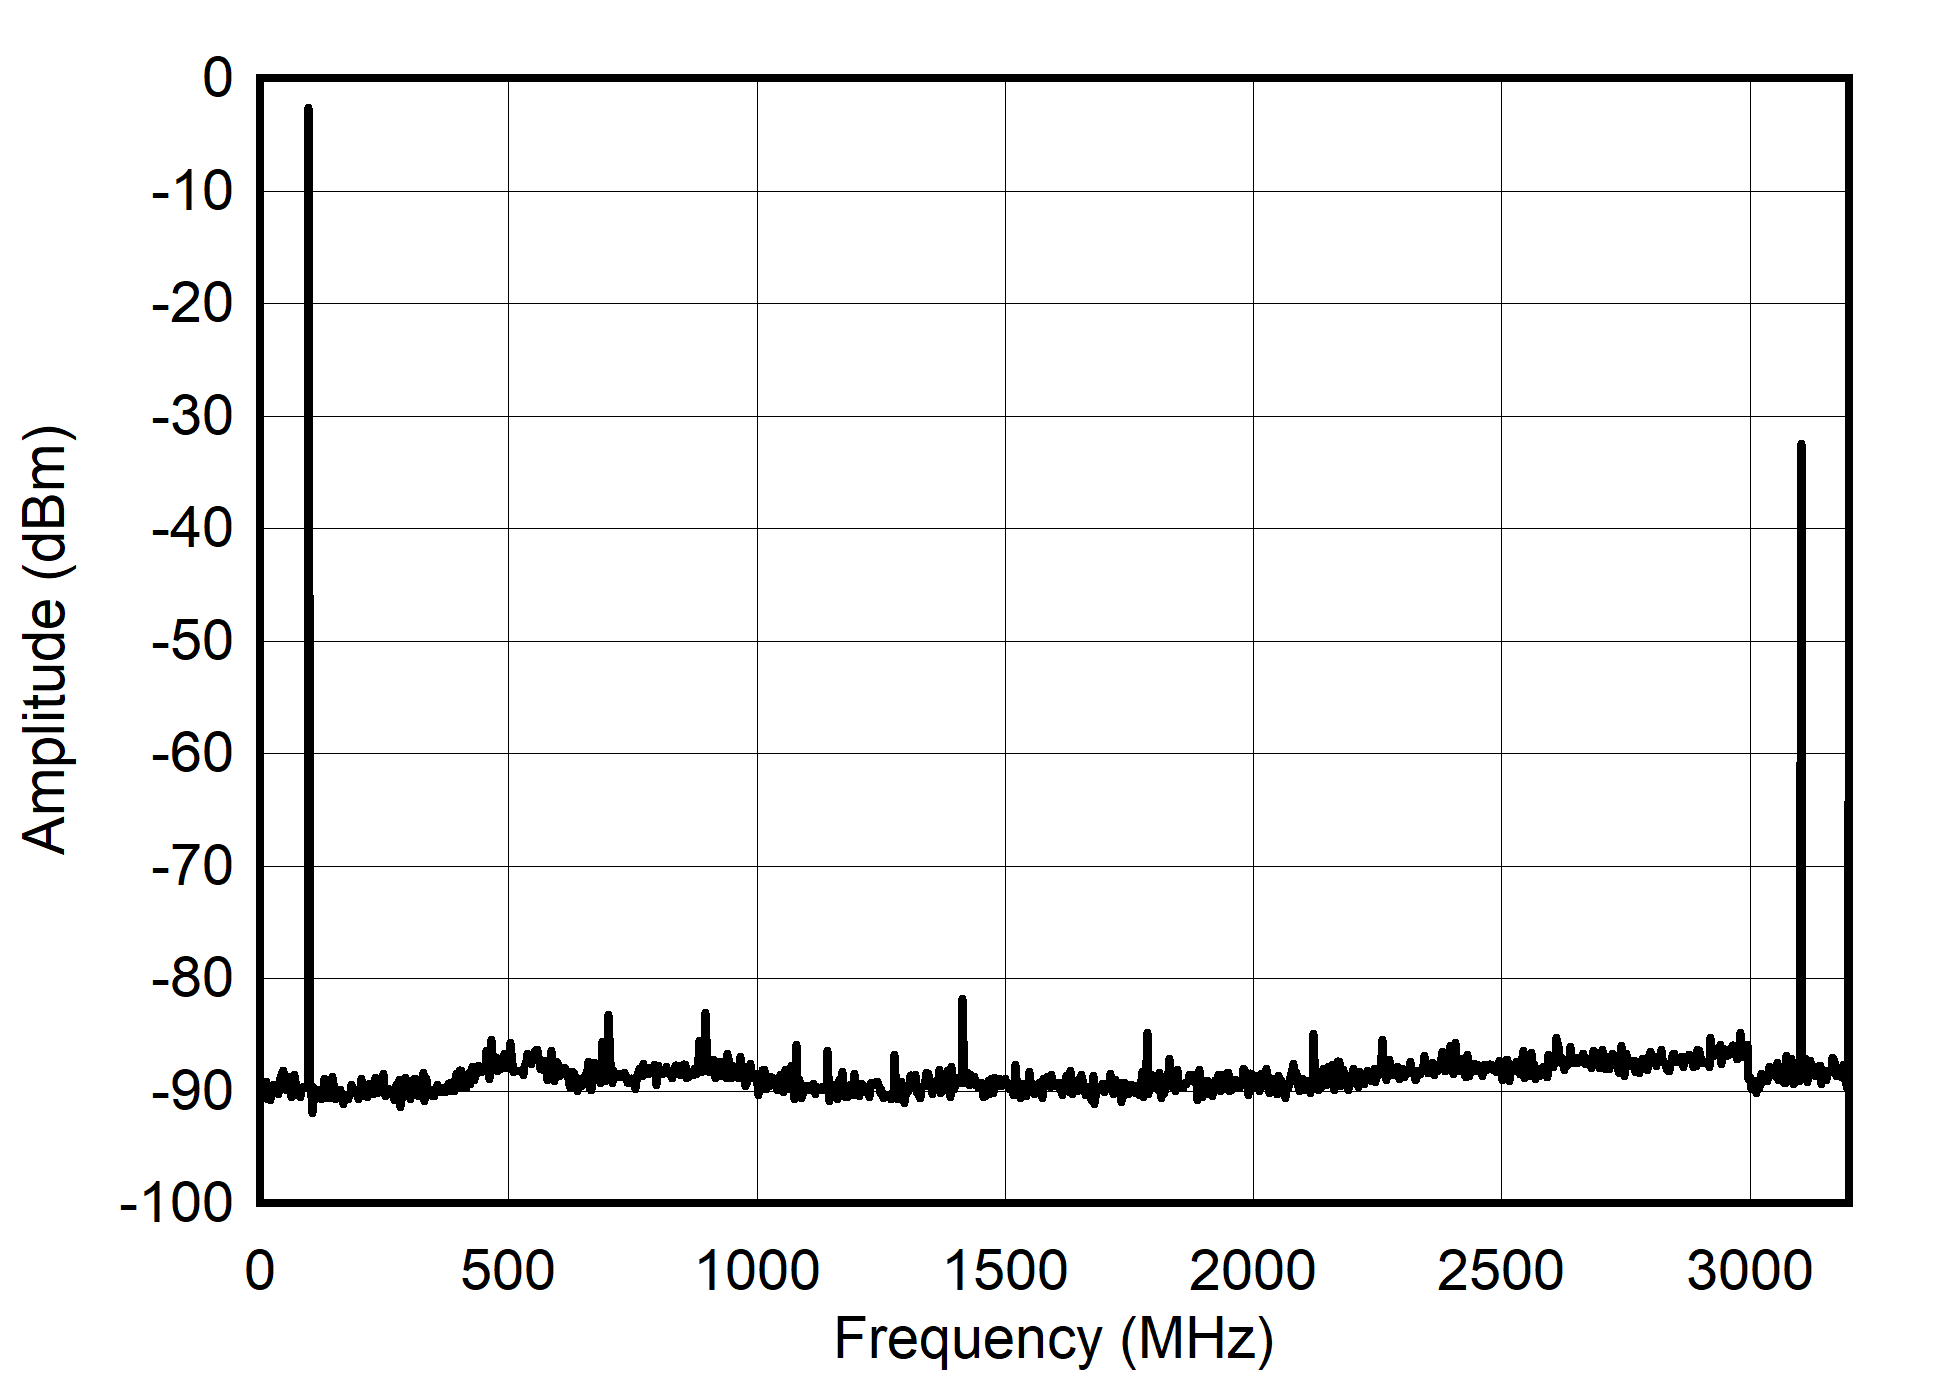
Figure 6-9 Dual
Channel NRZ Mode: Single Tone Spectrum at 100 MHz
Figure 6-11 Dual
Channel NRZ Mode: Single Tone Spectrum at 1 GHz
Figure 6-13 Dual
Channel NRZ Mode: Dual Tone Spectrum at 100 MHz ± 10 MHz
Figure 6-15 Dual
Channel NRZ Mode: Dual Tone Spectrum at 1 GHz ± 10 MHz
Figure 6-17 Dual
Channel RF Mode: Single Tone Spectrum at 1.7 GHz
Figure 6-19 Dual
Channel RF Mode: Single Tone Spectrum at 2.6 GHz
Figure 6-21 Dual
Channel RF Mode: Dual Tone Spectrum at 1.7G Hz ± 10 MHz
Figure 6-23 Dual
Channel RF Mode: Dual Tone Spectrum at 2.6 GHz ± 10 MHz
Figure 6-25 Dual
Channel RTZ Mode: Single Tone Spectrum at 100 MHz
Figure 6-27 Dual
Channel RTZ Mode: Single Tone Spectrum at 1 GHz
Figure 6-29 Dual
Channel RTZ Mode: Dual Tone Spectrum at 100 MHz ± 10 MHz
Figure 6-31 Dual
Channel RTZ Mode: Dual Tone Spectrum at 1 GHz ± 10 MHz
Figure 6-33 Dual
Channel 2xRF Mode: Single Tone Spectrum at 3.3 to 6.3 GHz
Figure 6-35 Dual
Channel 2xRF Mode: Single Tone Spectrum at 4.3 to 5.3 GHz
Figure 6-37 Dual
Channel 2xRF Mode: Dual Tone Spectrum at 3.3 to 6.3 GHz ± 10 MHz
Figure 6-39 Dual
Channel 2xRF Mode: Dual Tone Spectrum at 4.3 to 5.3 GHz ± 10 MHz
Figure 6-41 Single Channel NRZ Mode: Single Tone Spectrum at 200 MHz
Figure 6-43 Single Channel NRZ Mode: Single Tone Spectrum at 2 GHz
Figure 6-45 Single Channel NRZ Mode: Dual Tone Spectrum at 200 MHz ± 25 MHz
Figure 6-47 Single Channel NRZ Mode: Dual Tone Spectrum at 2 GHz ± 25 MHz
Figure 6-49 Single Channel RF Mode: Single Tone Spectrum at 3.4 GHz
Figure 6-51 Single Channel RF Mode: Single Tone Spectrum at 5.2 GHz
Figure 6-53 Single Channel RF Mode: Dual Tone Spectrum at 3.4 GHz ± 25 MHz
Figure 6-55 Single Channel RF Mode: Dual Tone Spectrum at 5.2 GHz ± 25 MHz
Figure 6-57 Single Channel RTZ Mode: Single Tone Spectrum at 200 MHz
Figure 6-59 Single Channel RTZ Mode: Single Tone Spectrum at 2 GHz
Figure 6-61 Single Channel RTZ Mode: Dual Tone Spectrum at 200 MHz ± 25 MHz
Figure 6-63 Single Channel RTZ Mode: Dual Tone Spectrum at 2 GHz ± 25 MHz
Figure 6-65 Dual
Channel NRZ and RF Mode: SFDR vs Output Frequency and Output Current
Figure 6-67 Dual
Channel NRZ and RF Mode: HD3 vs Output Frequency and Output Current
Figure 6-69 Dual
Channel NRZ and RF Mode: IMD3 vs Output Frequency and Output Current
Figure 6-71 Dual
Channel NRZ and RF Mode: HD2 vs Output Frequency and Digital Level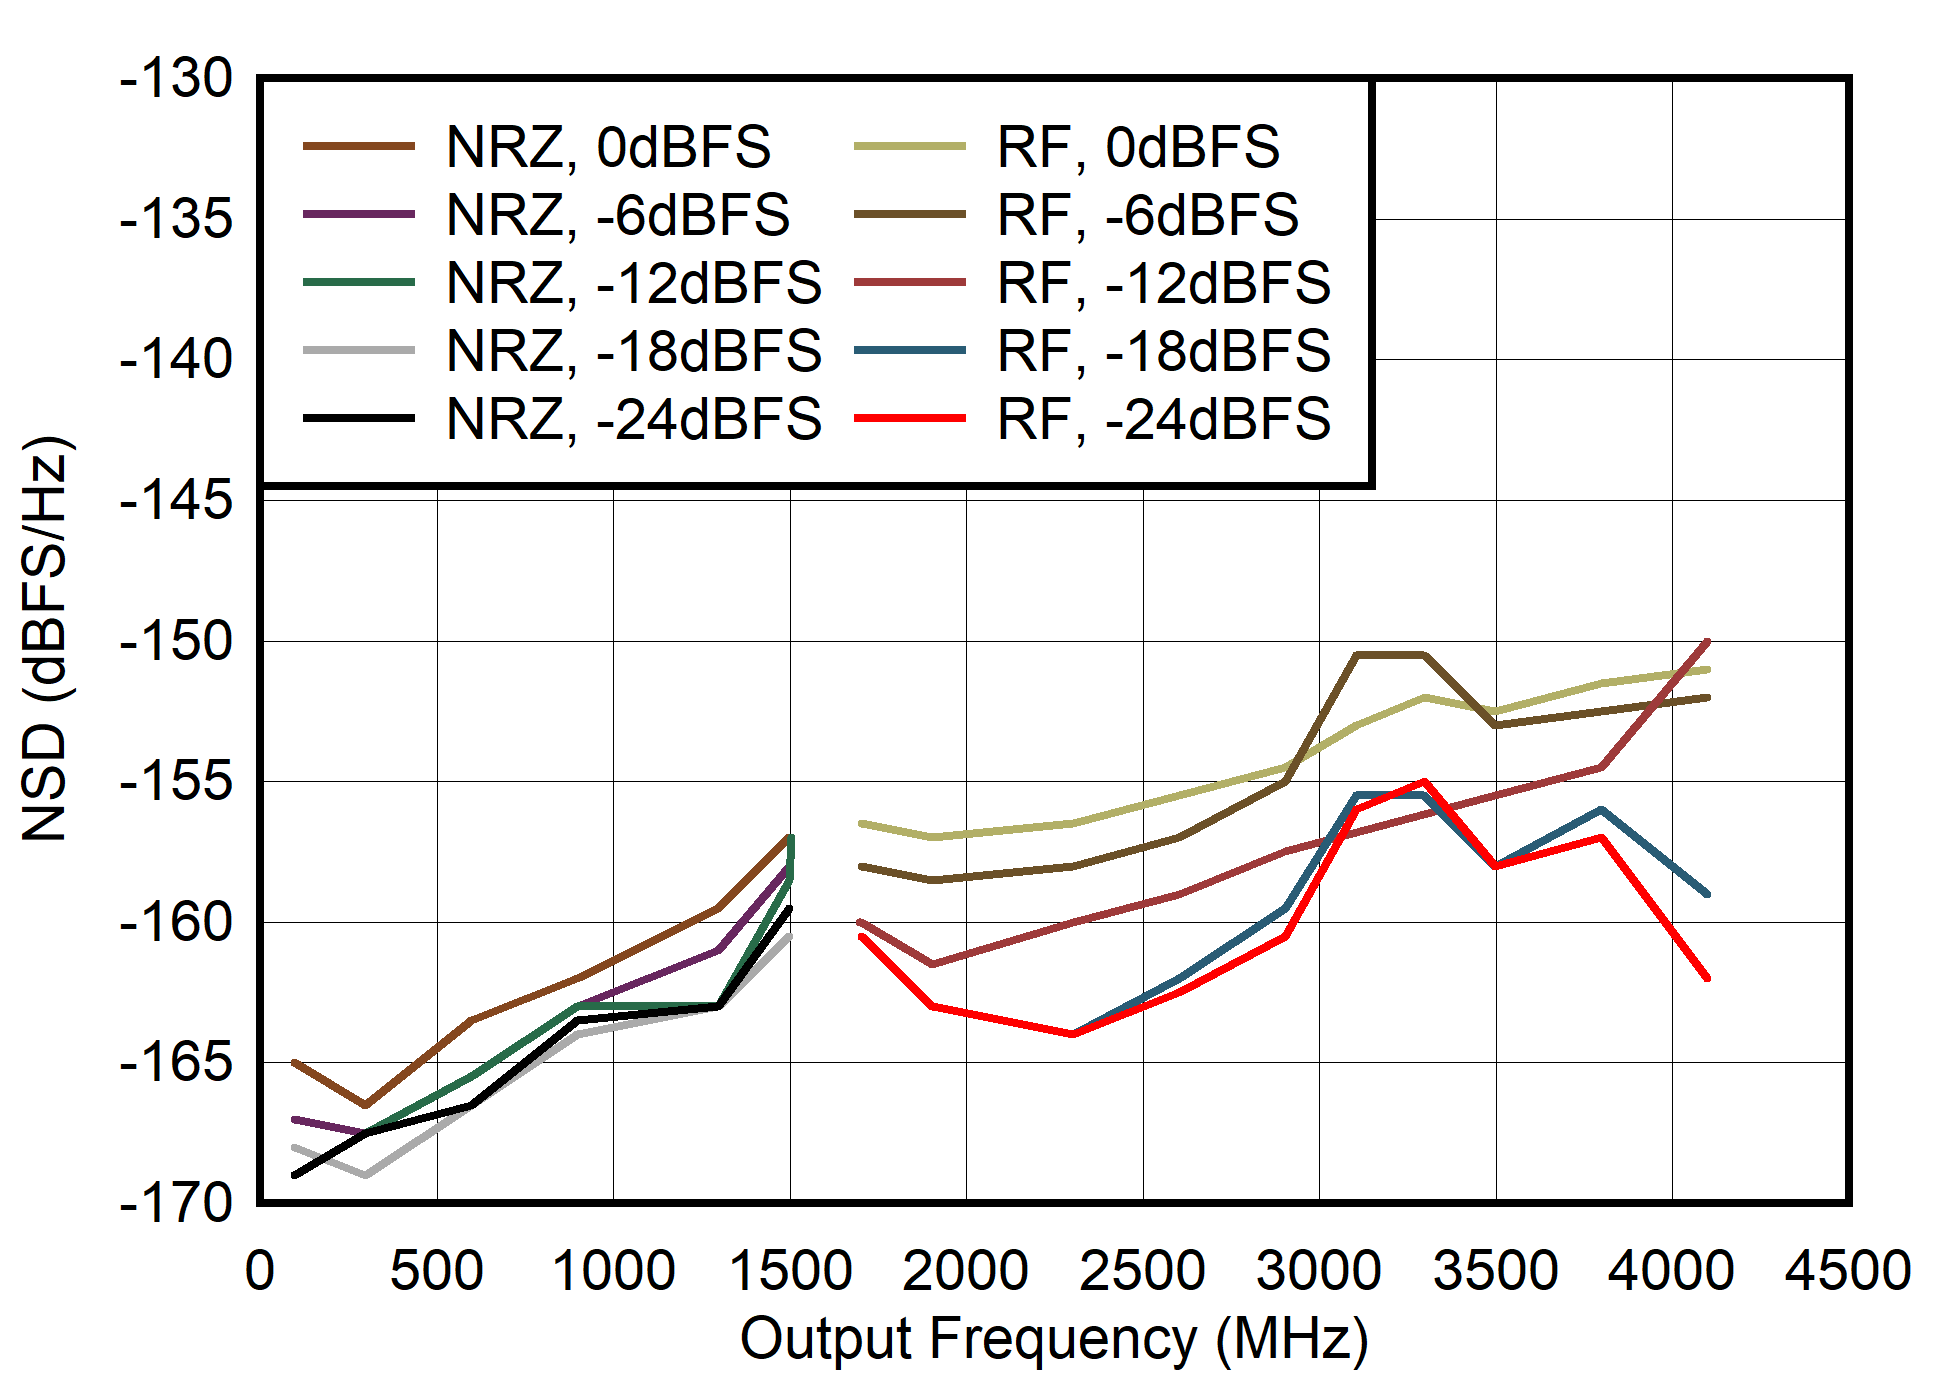
Figure 6-73 Dual
Channel NRZ and RF Mode: NSD vs Output Frequency and Digital Level
Figure 6-75 Dual
Channel RTZ Mode: SFDR vs Output Frequency and Digital Level
Figure 6-77 Dual
Channel RTZ Mode: HD3 vs Output Frequency and Digital Level
Figure 6-79 Dual
Channel RTZ Mode: IMD3 vs Output Frequency and Digital Level
Figure 6-81 Dual
Channel RTZ Mode: HD2 vs Output Frequency and Output Current
Figure 6-83 Dual
Channel RTZ Mode: NSD vs Output Frequency and Output Current
Figure 6-85 Dual
Channel 2xRF Mode: SFDR vs Output Frequency and Digital Level
Figure 6-87 Dual
Channel 2xRF Mode: HD3 vs Output Frequency and Digital Level
Figure 6-89 Dual
Channel 2xRF Mode: IMD3 vs Output Frequency and Digital Level
Figure 6-91 Dual
Channel 2xRF Mode: HD2 vs Output Frequency and Output Current
Figure 6-93 Dual
Channel 2xRF Mode: NSD vs Output Frequency and Output Current
Figure 6-95 Single Channel NRZ and RF Modes: SFDR vs Output Frequency and Output
Current
Figure 6-97 Single Channel NRZ and RF Modes: HD3 vs Output Frequency and Output
Current
Figure 6-99 Single Channel NRZ and RF Modes: IMD3 vs Output Frequency and Output
Current
Figure 6-101 Single Channel NRZ and RF Modes: HD2 vs Output Frequency and Digital
Level
Figure 6-103 Single Channel NRZ and RF Modes: Noise Spectral Density vs Output Frequency
and Digital Level
Figure 6-105 Single Channel RTZ Mode: SFDR vs Output Frequency and Output
Current
Figure 6-107 Single Channel RTZ Mode: HD3 vs Output Frequency and Output Current
Figure 6-109 Single Channel RTZ Mode: IMD3 vs Output Frequency and Output
Current
Figure 6-111 Single Channel RTZ Mode: HD2 vs Output Frequency and Digital Level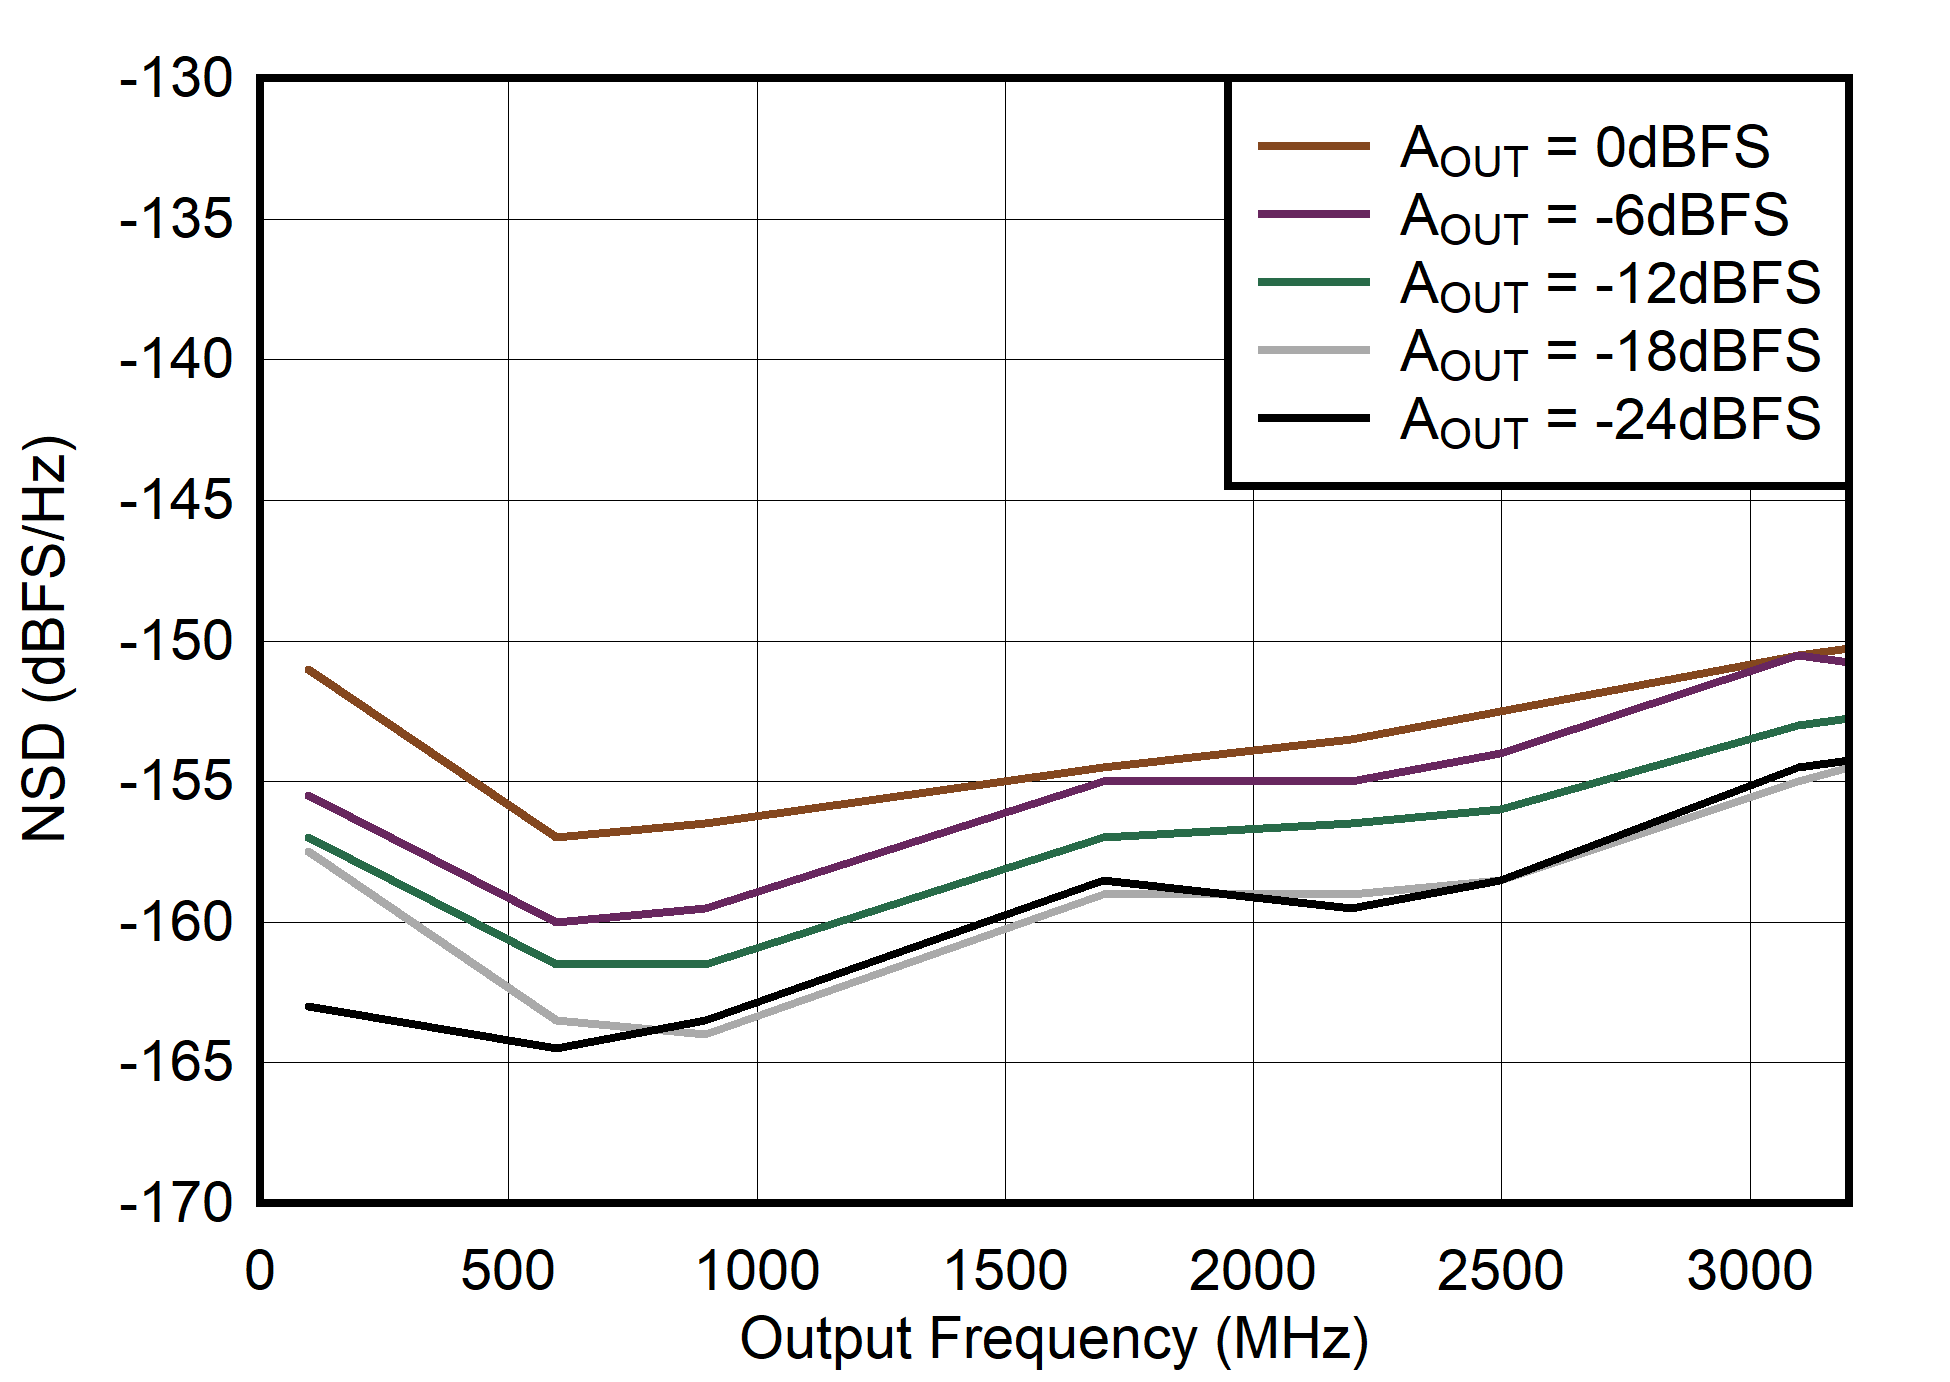
Figure 6-113 Single Channel RTZ Mode: NSD vs Output Frequency and Digital Level
Figure 6-115 Dual
Channel NRZ and RF Modes: NPR vs Digital Level
Figure 6-117 Dual
Channel 2xRF Mode: NPR vs Digital Level
Figure 6-119 Single Channel RTZ Mode: NPR vs Digital Level
Figure 6-121 Single Channel Mode: IMD3 vs Supply Voltage
Figure 6-123 Single Channel Mode: IMD3 vs Temperature
Figure 6-125 Dual
Channel Mode: Power Dissipation vs Sample Rate
Figure 6-127 Dual
Channel Mode: IVDDA vs Sample Rate
Figure 6-129 Dual
Channel Mode: IVDDCLK vs Sample Rate
Figure 6-131 Dual
Channel Mode: IVDDE vs Sample Rate
Figure 6-133 Dual
Channel Mode: IVEE18 vs Sample Rate
Figure 6-135 Single Channel Mode: IVDDA18 vs Sample Rate
Figure 6-137 Single Channel Mode: IVDDCLK18 vs Sample Rate
Figure 6-139 Single Channel Mode: IVDDDIG vs Sample Rate
Figure 6-141 Single Channel Mode: IVDDIO vs Sample Rate
Figure 6-2 Output Current INL vs Code
Figure 6-4 Single Channel NRZ Mode: Output Power vs Output Frequency
Figure 6-6 Single Channel Mode: DAC12DL3200EVM Output Power vs Output
Frequency
Figure 6-8 Single Channel RTZ Mode: Output Power vs Output Frequency
Figure 6-10 Dual
Channel NRZ Mode: Single Tone Spectrum at 500 MHz
Figure 6-12 Dual
Channel NRZ Mode: Single Tone Spectrum at 1.5 GHz
Figure 6-14 Dual
Channel NRZ Mode: Dual Tone Spectrum at 500 MHz ± 10 MHz
Figure 6-16 Dual
Channel NRZ Mode: Dual Tone Spectrum at 1.5 GHz ± 10 MHz
Figure 6-18 Dual
Channel RF Mode: Single Tone Spectrum at 2.1 GHz
Figure 6-20 Dual
Channel RF Mode: Single Tone Spectrum at 3.1 GHz
Figure 6-22 Dual
Channel RF Mode: Dual Tone Spectrum at 2.1 GHz ± 10 MHz
Figure 6-24 Dual
Channel RF Mode: Dual Tone Spectrum at 3.1 GHz ± 10 MHz
Figure 6-26 Dual
Channel RTZ Mode: Single Tone Spectrum at 500 MHz
Figure 6-28 Dual
Channel RTZ Mode: Single Tone Spectrum at 1.5 GHz
Figure 6-30 Dual
Channel RTZ Mode: Dual Tone Spectrum at 500 MHz ± 10 MHz
Figure 6-32 Dual
Channel RTZ Mode: Dual Tone Spectrum at 1.5 GHz ± 10 MHz
Figure 6-34 Dual
Channel 2xRF Mode: Single Tone Spectrum at 3.8 to 5.8 GHz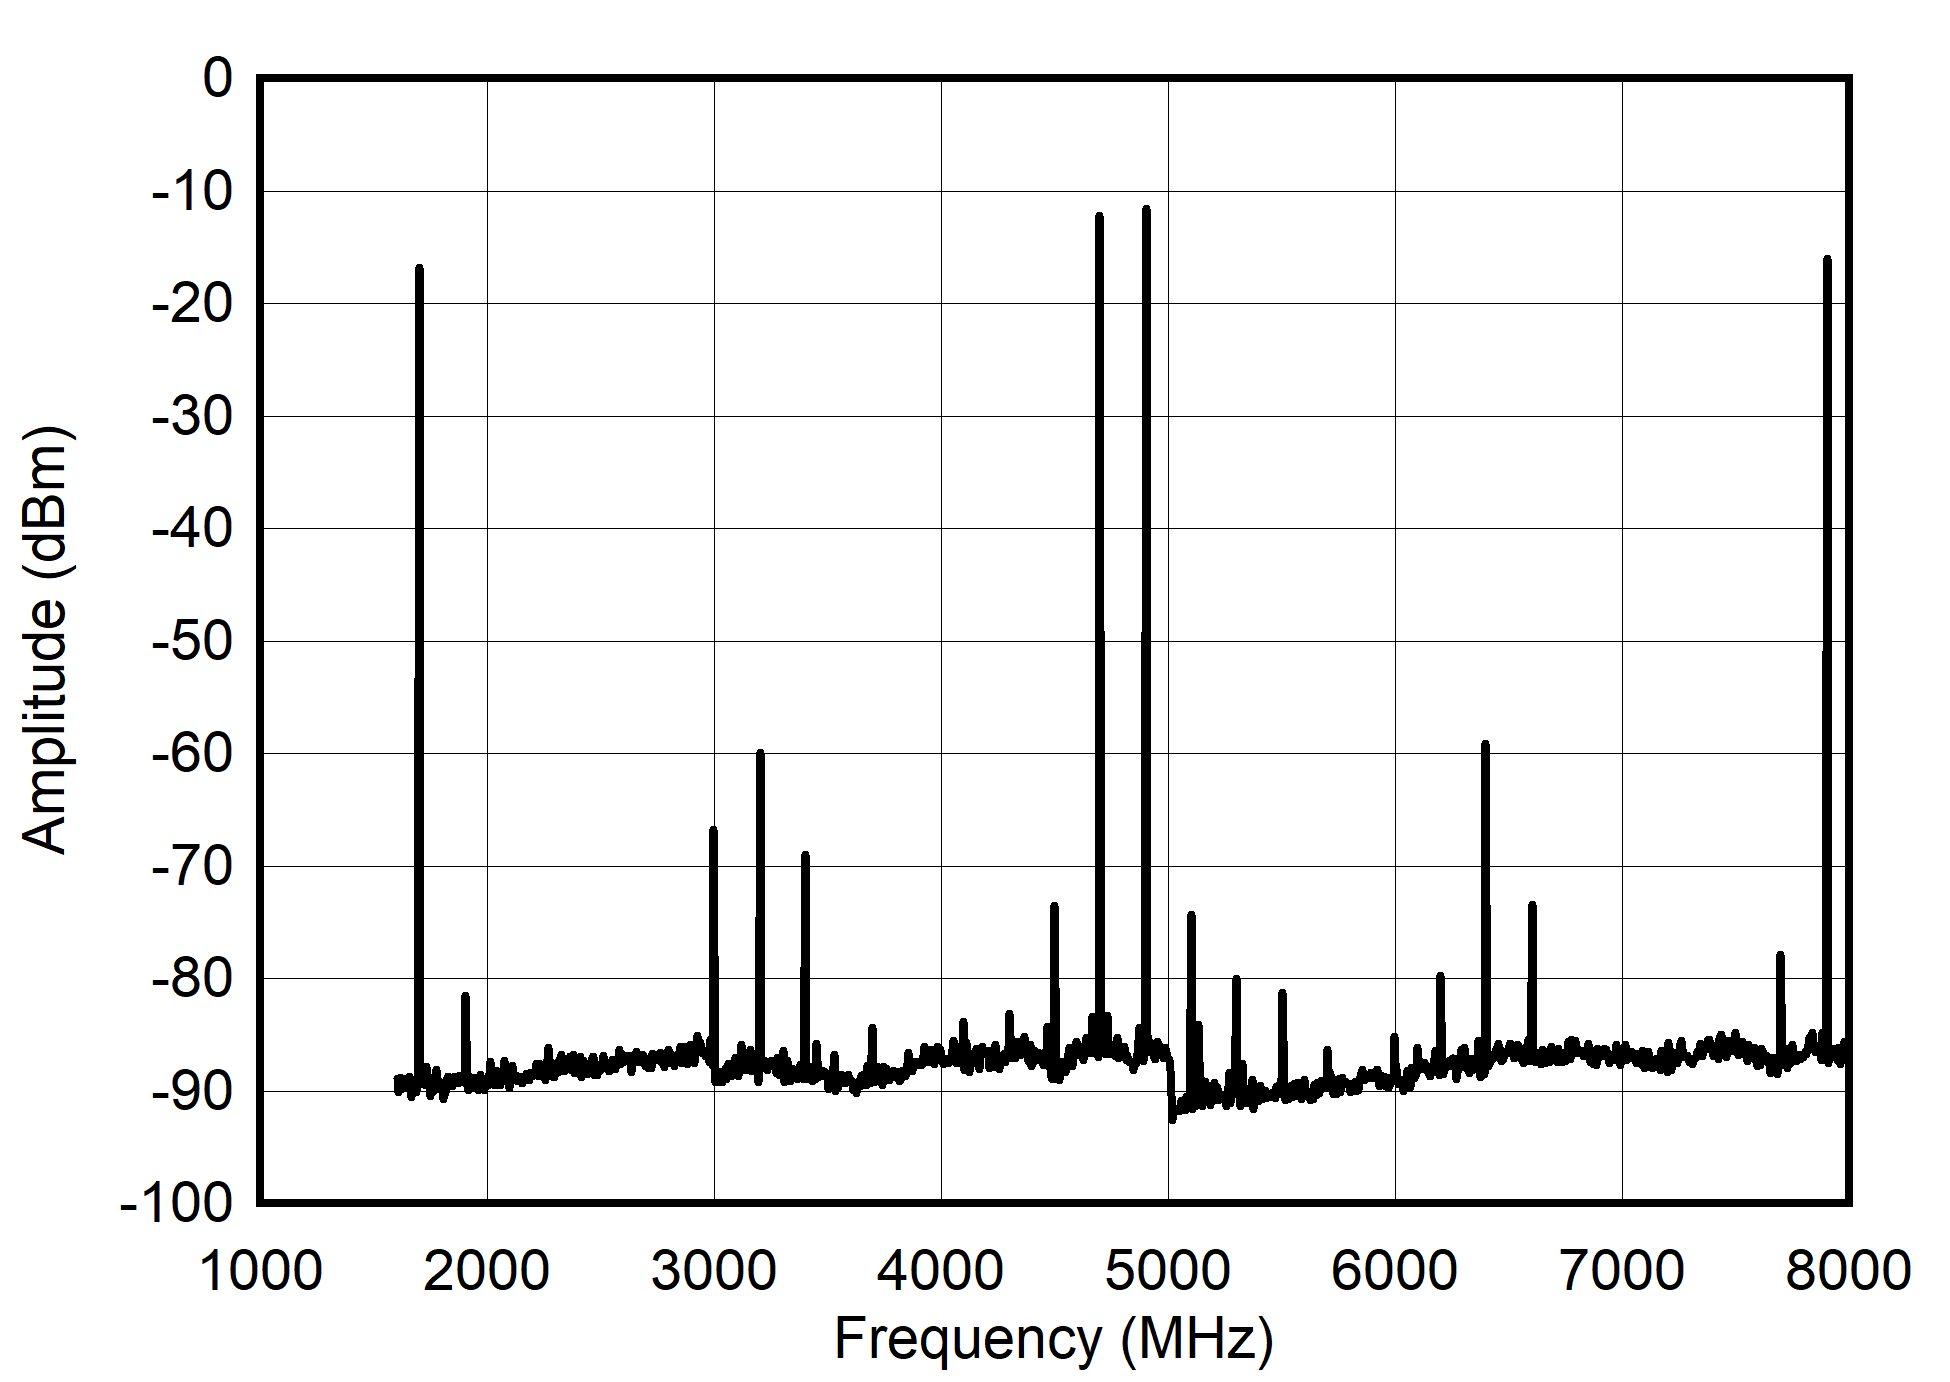
Figure 6-36 Dual
Channel 2xRF Mode: Single Tone Spectrum at 4.7 to 4.9 GHz
Figure 6-38 Dual
Channel 2xRF Mode: Dual Tone Spectrum at 3.8 to 5.8 GHz ± 10 MHz
Figure 6-40 Dual
Channel 2xRF Mode: Dual Tone Spectrum at 4.7 to 4.9 GHz ± 10 MHz
Figure 6-42 Single Channel NRZ Mode: Single Tone Spectrum at 1 GHz
Figure 6-44 Single Channel NRZ Mode: Single Tone Spectrum at 3 GHz
Figure 6-46 Single Channel NRZ Mode: Dual Tone Spectrum at 1 GHz ± 25 MHz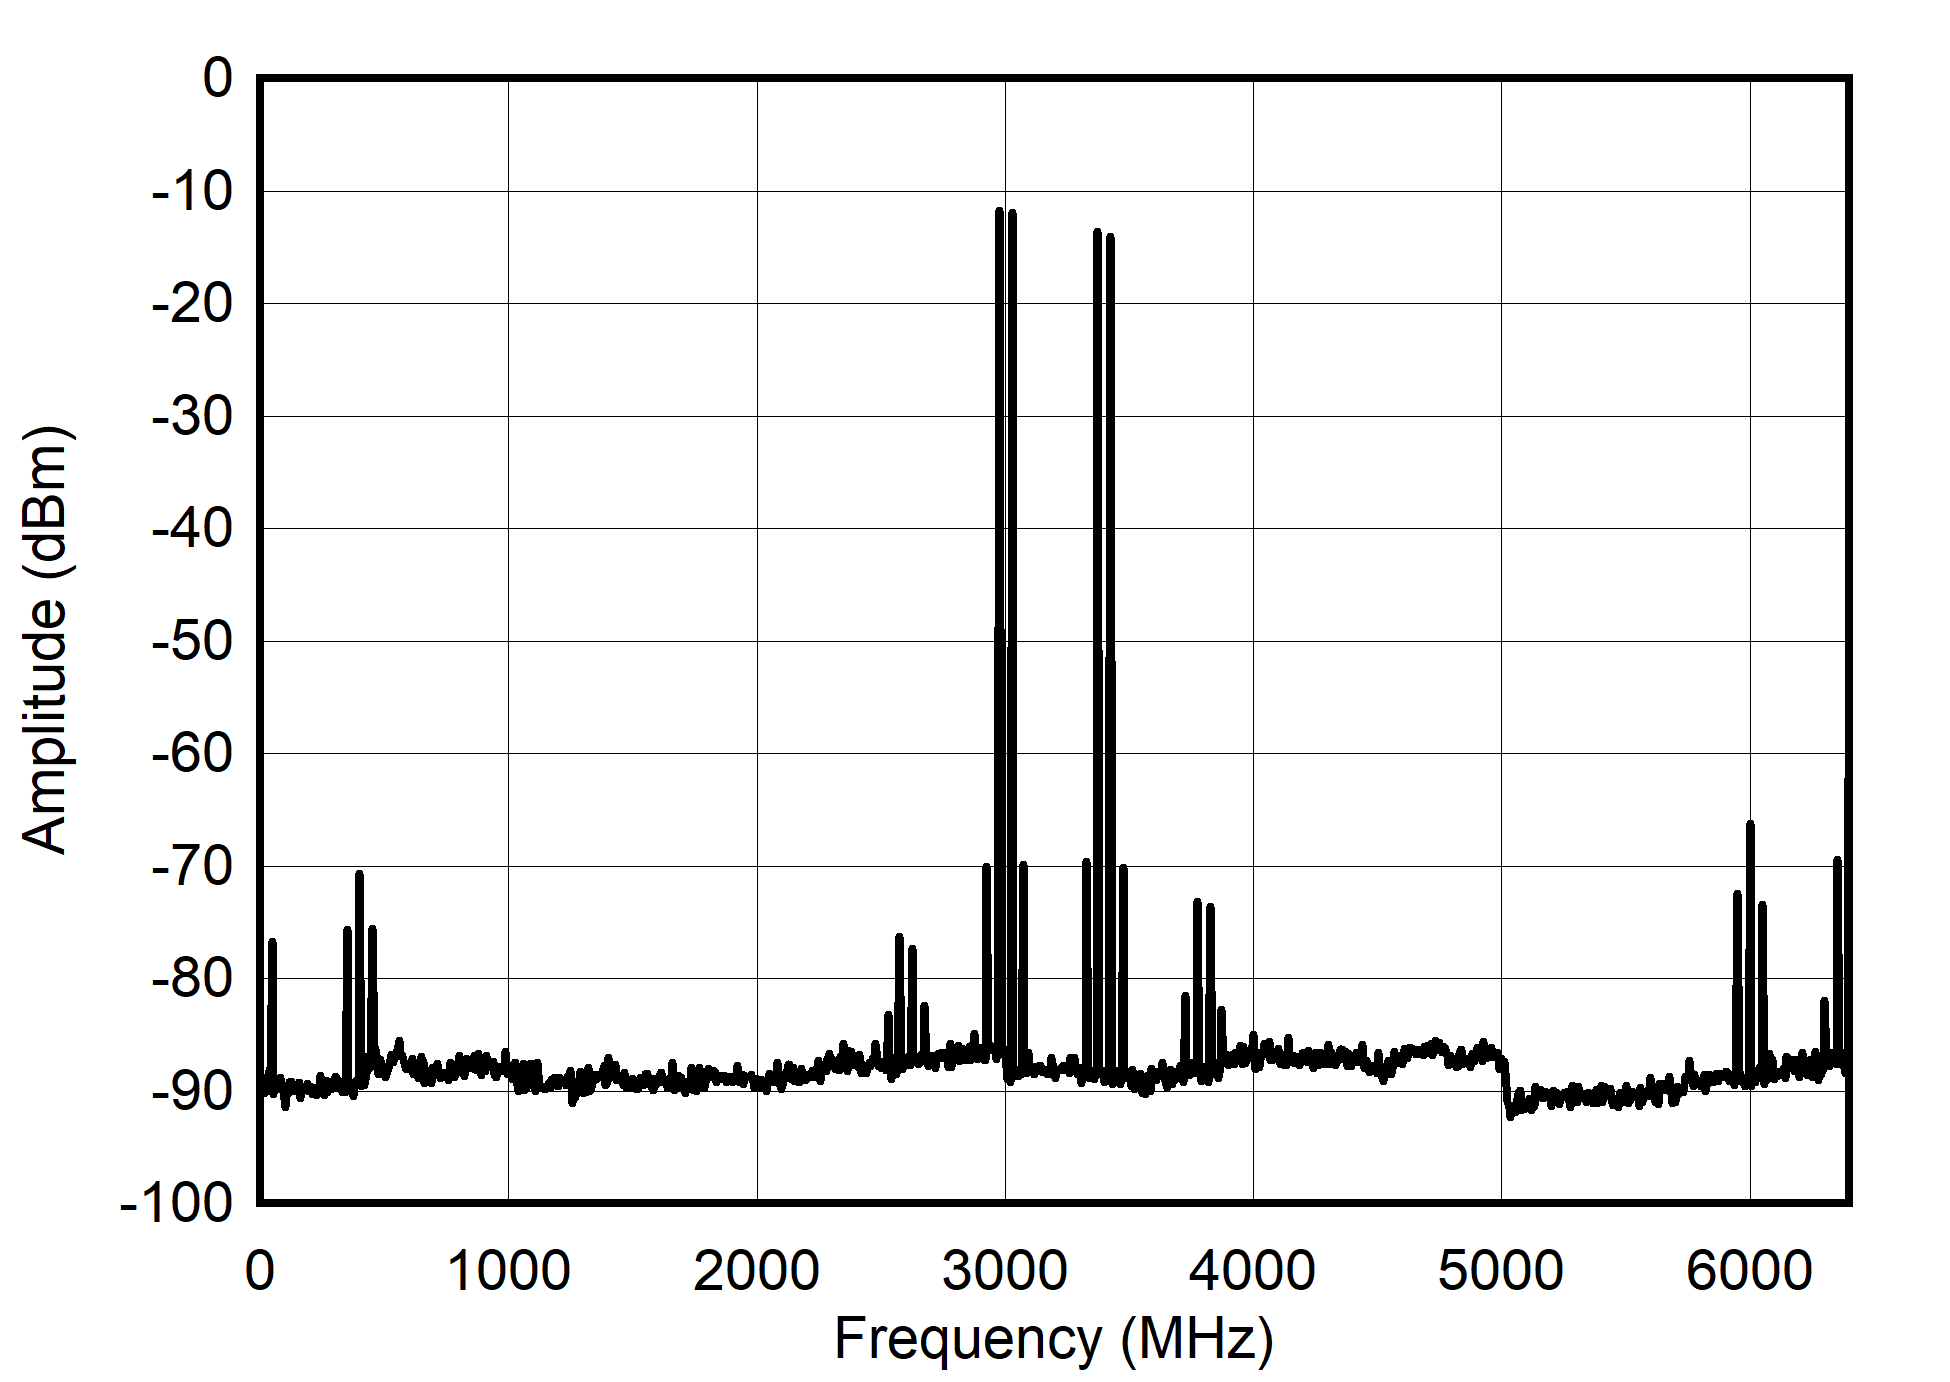
Figure 6-48 Single Channel NRZ Mode: Dual Tone Spectrum at 3 GHz ± 25 MHz
Figure 6-50 Single Channel RF Mode: Single Tone Spectrum at 4.2 GHz
Figure 6-52 Single Channel RF Mode: Single Tone Spectrum at 6.2 GHz
Figure 6-54 Single Channel RF Mode: Dual Tone Spectrum at 4.2 GHz ± 25 MHz
Figure 6-56 Single Channel RF Mode: Dual Tone Spectrum at 6.2 GHz ± 25 MHz
Figure 6-58 Single Channel RTZ Mode: Single Tone Spectrum at 1 GHz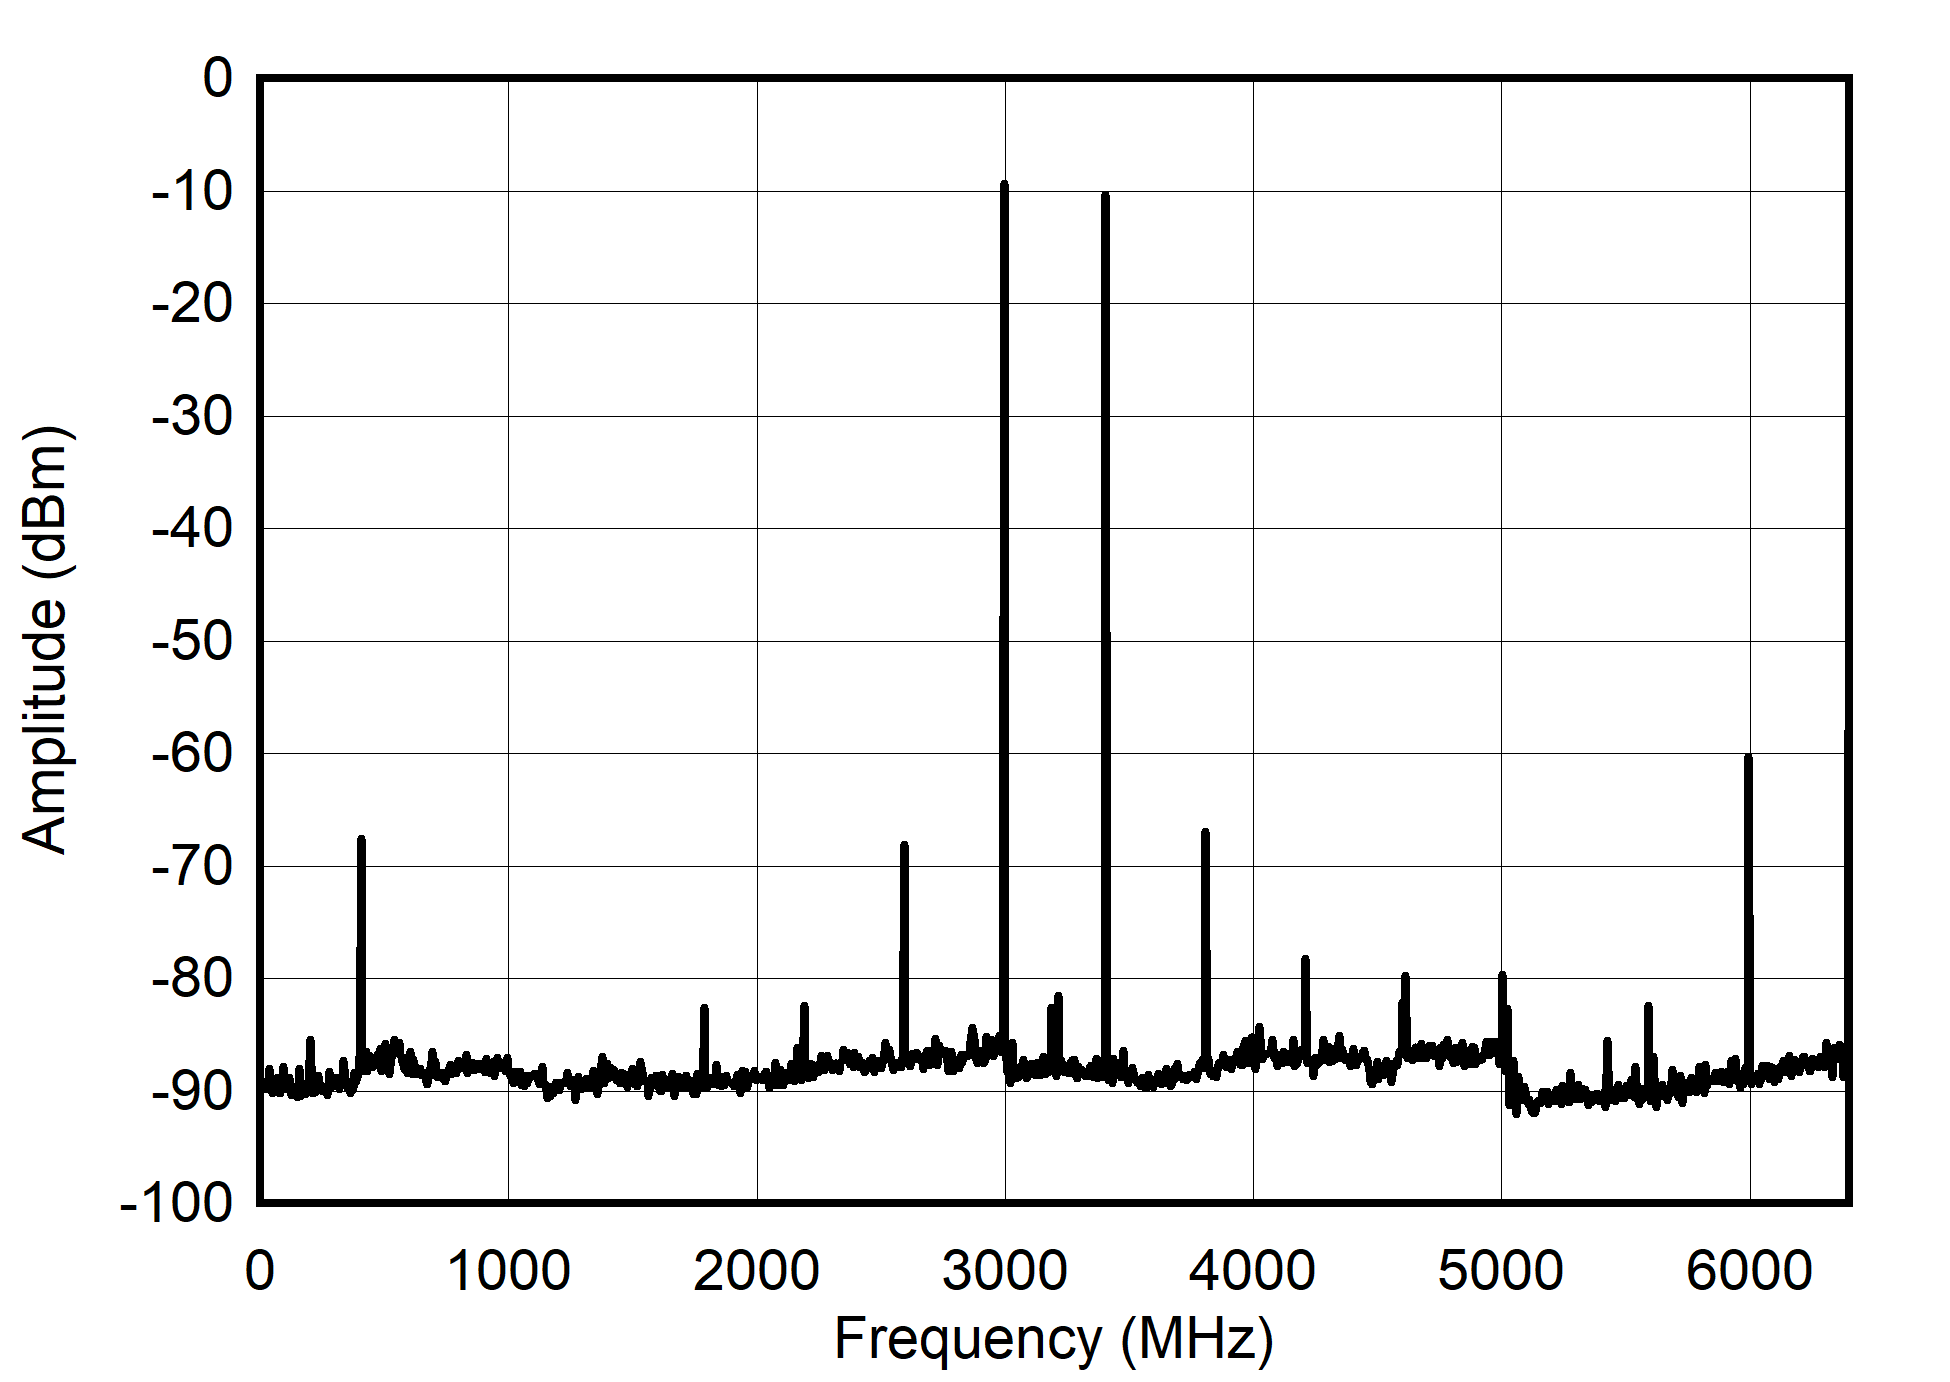
Figure 6-60 Single Channel RTZ Mode: Single Tone Spectrum at 3 GHz
Figure 6-62 Single Channel RTZ Mode: Dual Tone Spectrum at 1 GHz ± 25 MHz
Figure 6-64 Single Channel RTZ Mode: Dual Tone Spectrum at 3 GHz ± 25 MHz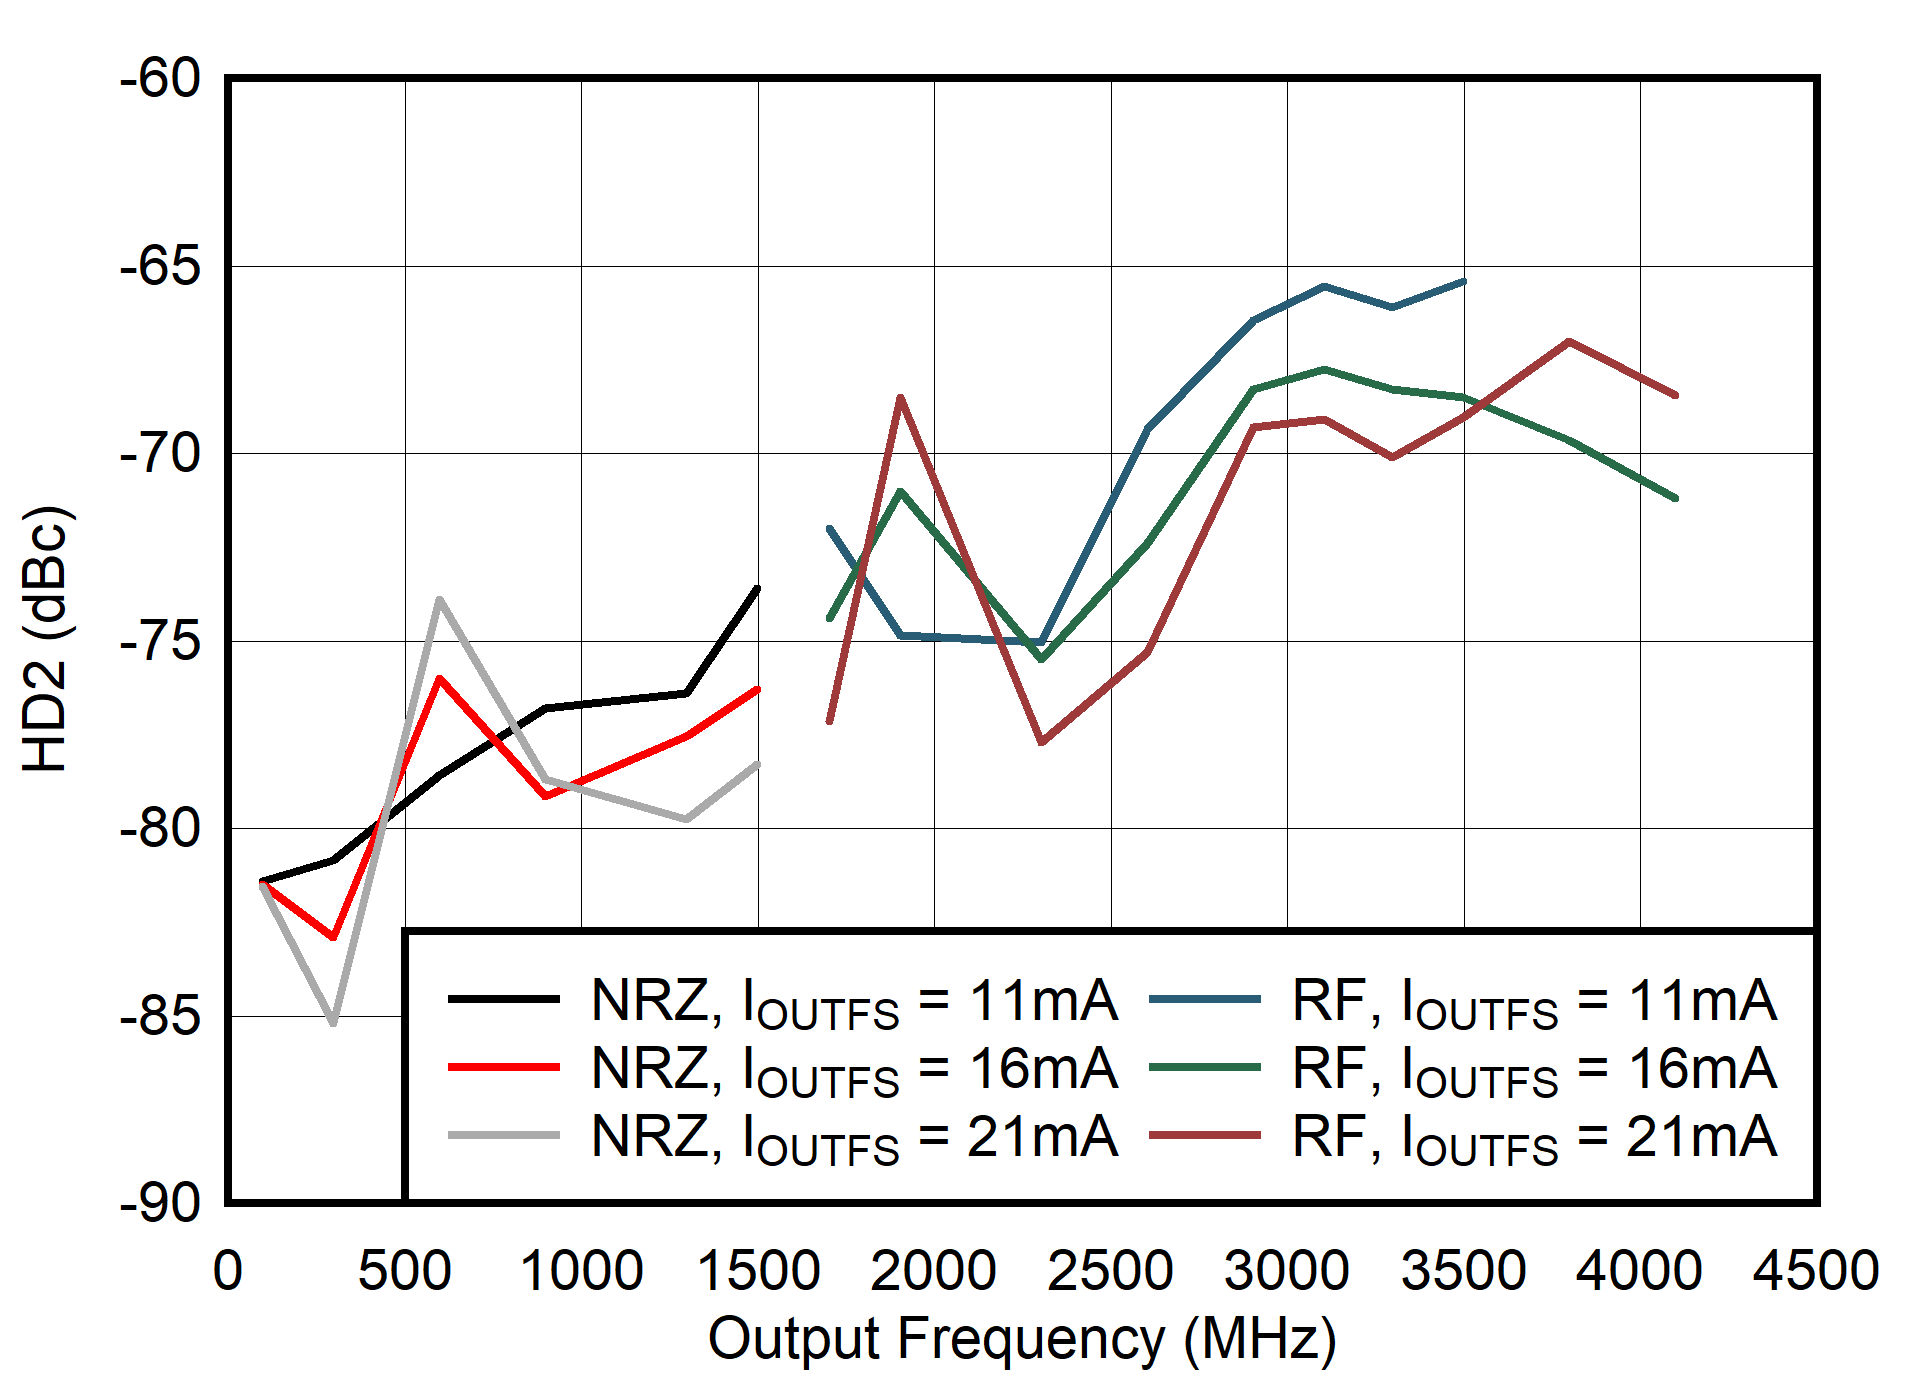
Figure 6-66 Dual
Channel NRZ and RF Mode: HD2 vs Output Frequency and Output Current
Figure 6-68 Dual
Channel NRZ and RF Mode: NSD vs Output Frequency and Output Current
Figure 6-70 Dual
Channel NRZ and RF Mode: SFDR vs Output Frequency and Digital Level
Figure 6-72 Dual
Channel NRZ and RF Mode: HD3 vs Output Frequency and Digital Level
Figure 6-74 Dual
Channel NRZ and RF Modes: IMD3 vs Output Frequency and Digital Level
Figure 6-76 Dual
Channel RTZ Mode: HD2 vs Output Frequency and Digital Level
Figure 6-78 Dual
Channel RTZ Mode: NSD vs Output Frequency and Digital Level
Figure 6-80 Dual
Channel RTZ Mode: SFDR vs Output Frequency and Output Current
Figure 6-82 Dual
Channel RTZ Mode: HD3 vs Output Frequency and Output Current
Figure 6-84 Dual
Channel RTZ Mode: IMD3 vs Output Frequency and Output Current
Figure 6-86 Dual
Channel 2xRF Mode: HD2 vs Output Frequency and Digital Level
Figure 6-88 Dual
Channel 2xRF Mode: NSD vs Output Frequency and Digital Level
Figure 6-90 Dual
Channel 2xRF Mode: SFDR vs Output Frequency and Output Current
Figure 6-92 Dual
Channel 2xRF Mode: HD3 vs Output Frequency and Output Current
Figure 6-94 Dual
Channel 2xRF Mode: IMD3 vs Output Frequency and Output Current
Figure 6-96 Single Channel NRZ and RF Modes: HD2 vs Output Frequency and Output
Current
Figure 6-98 Single Channel NRZ and RF Modes: NSD vs Output Frequency and Output
Current
Figure 6-100 Single Channel NRZ and RF Modes: SFDR vs Output Frequency and Digital
Level
Figure 6-102 Single Channel NRZ and RF Modes: HD3 vs Output Frequency and Digital
Level
Figure 6-104 Single Channel NRZ and RF Modes: IMD3 vs Output Frequency and Digital
Level
Figure 6-106 Single Channel RTZ Mode: HD2 vs Output Frequency and Output Current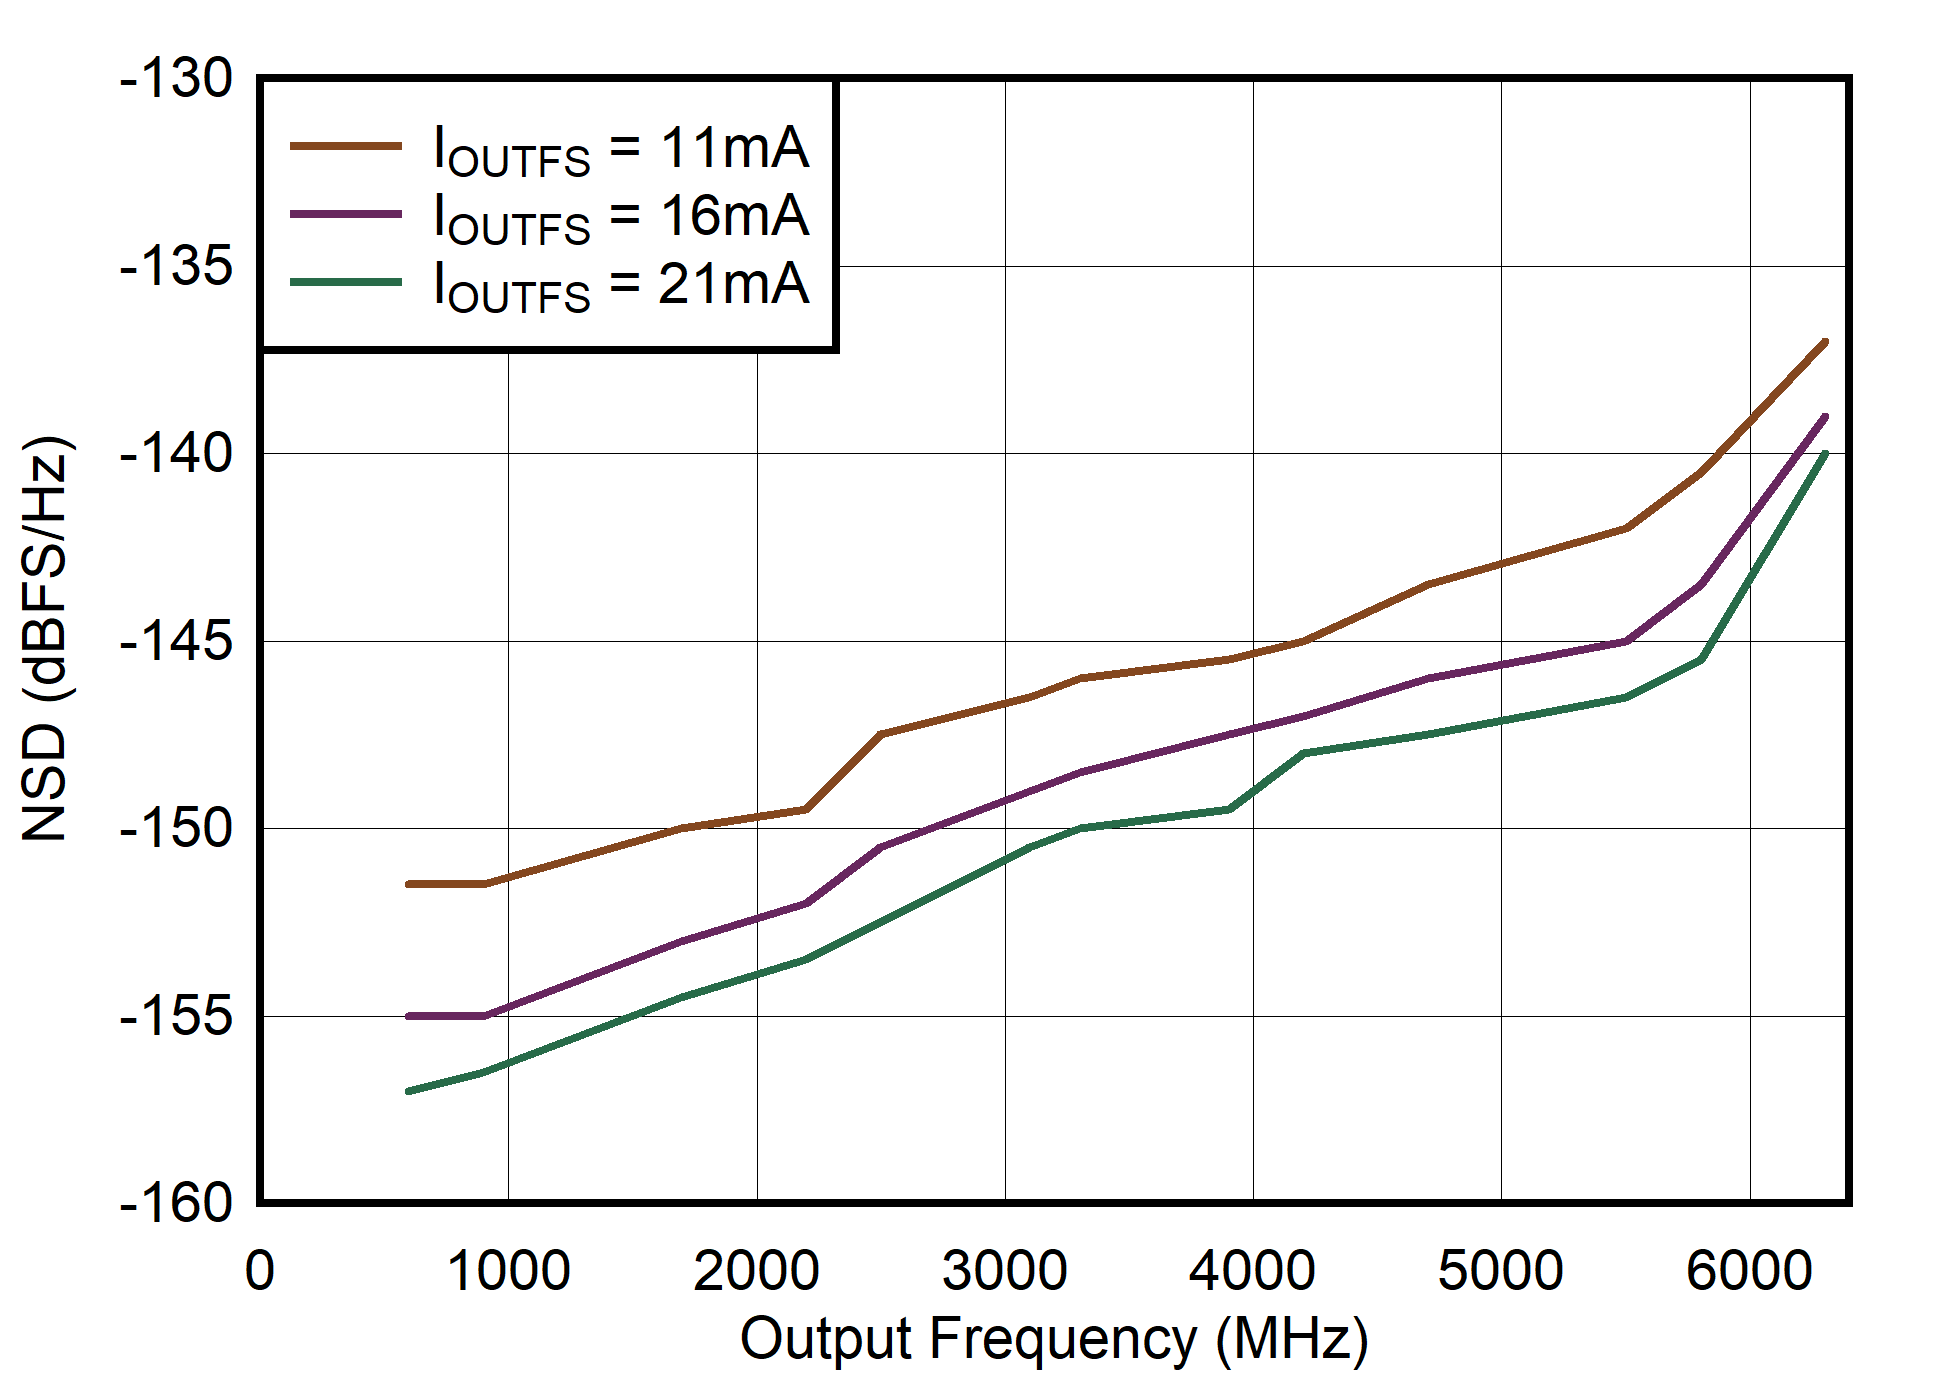
Figure 6-108 Single Channel RTZ Mode: NSD vs Output Frequency and Output Current
Figure 6-110 Single Channel RTZ Mode: SFDR vs Output Frequency and Digital Level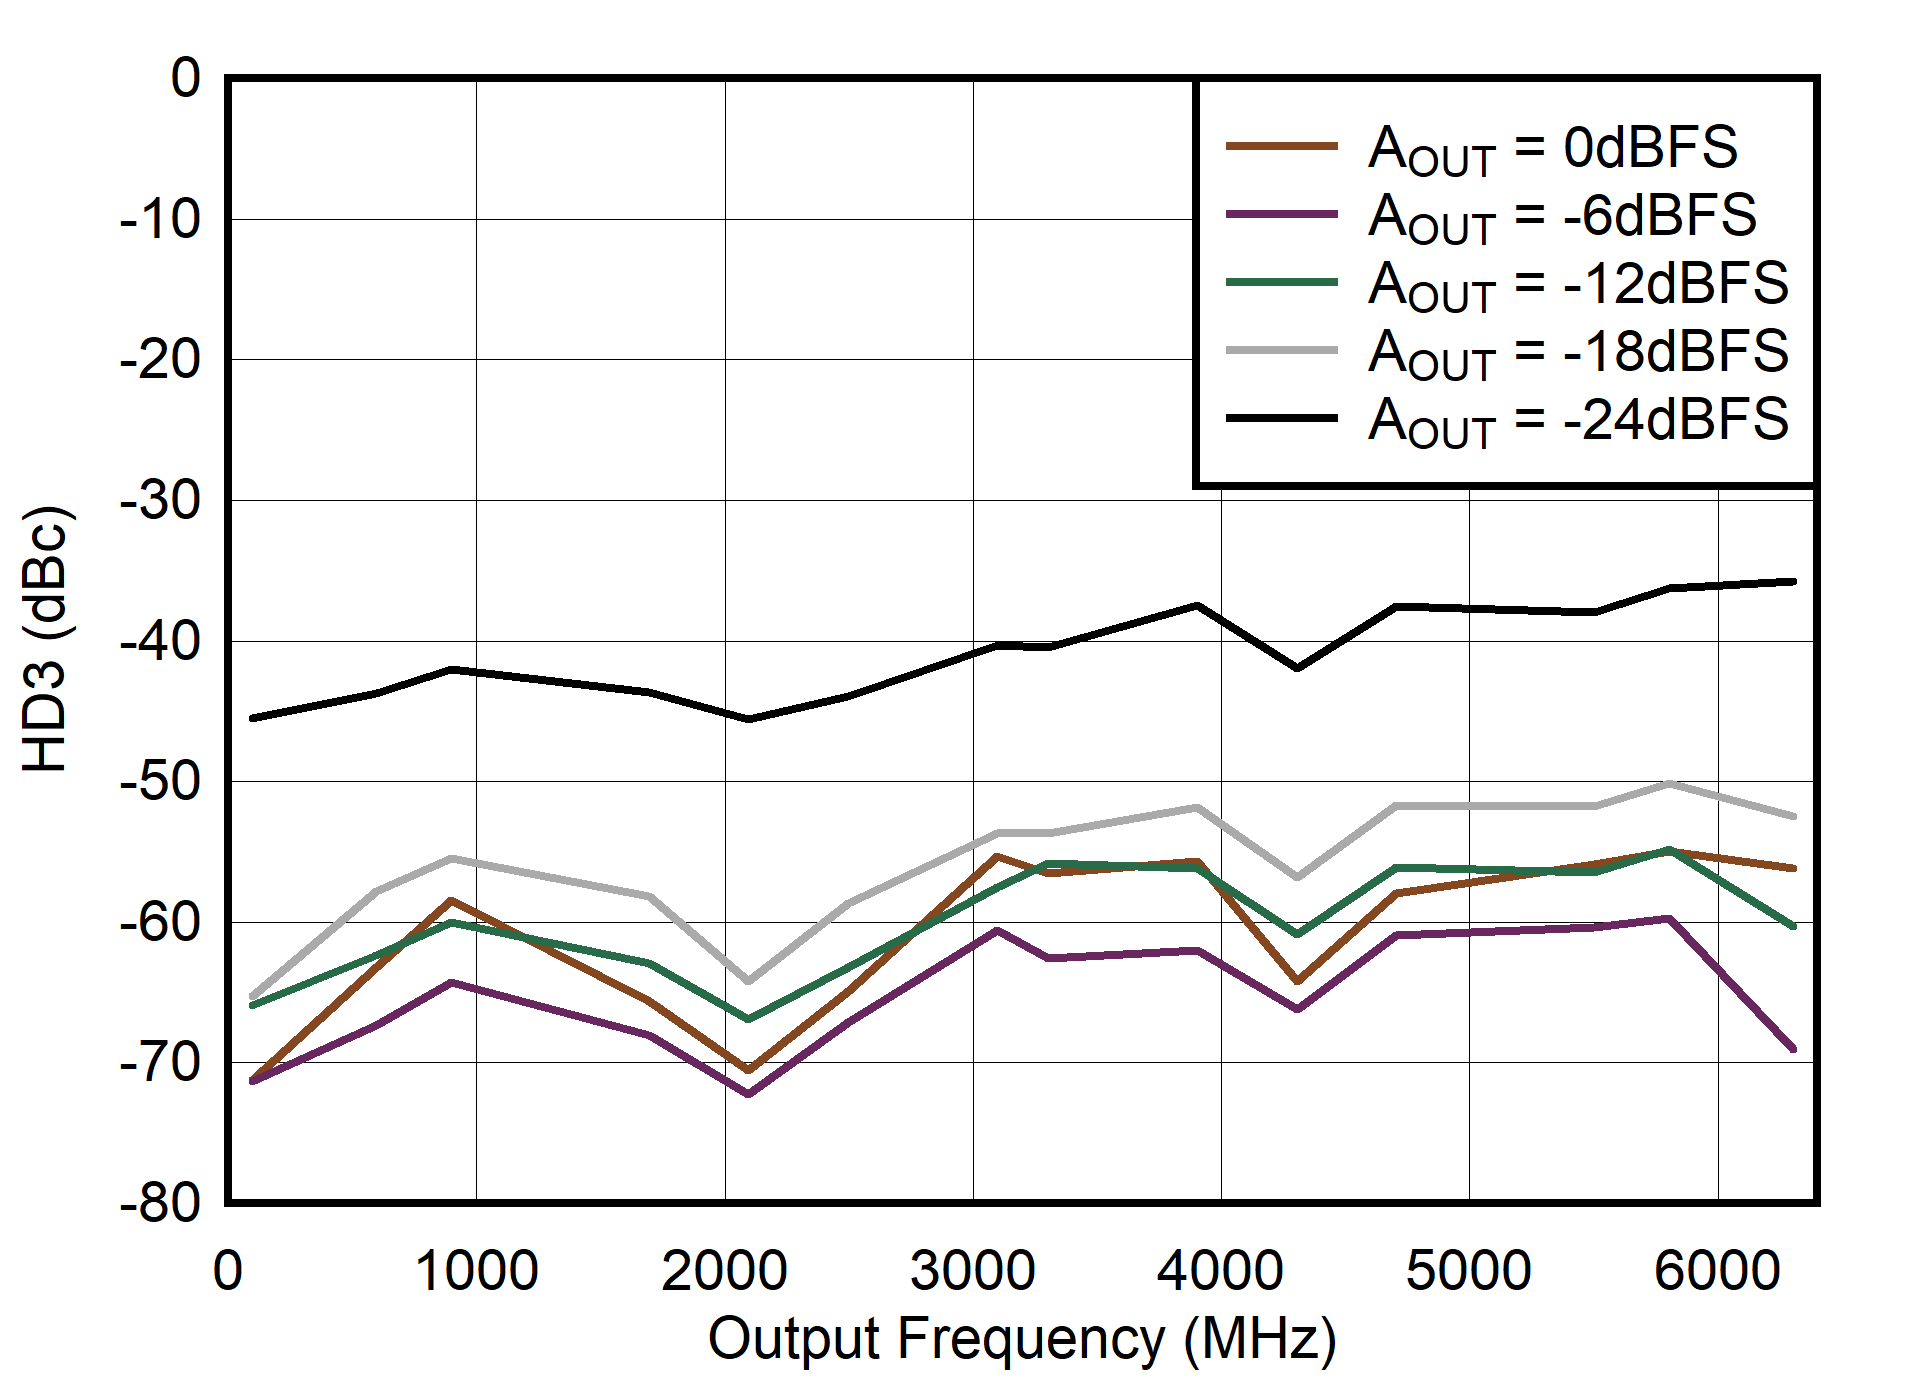
Figure 6-112 Single Channel RTZ Mode: HD3 vs Output Frequency and Digital Level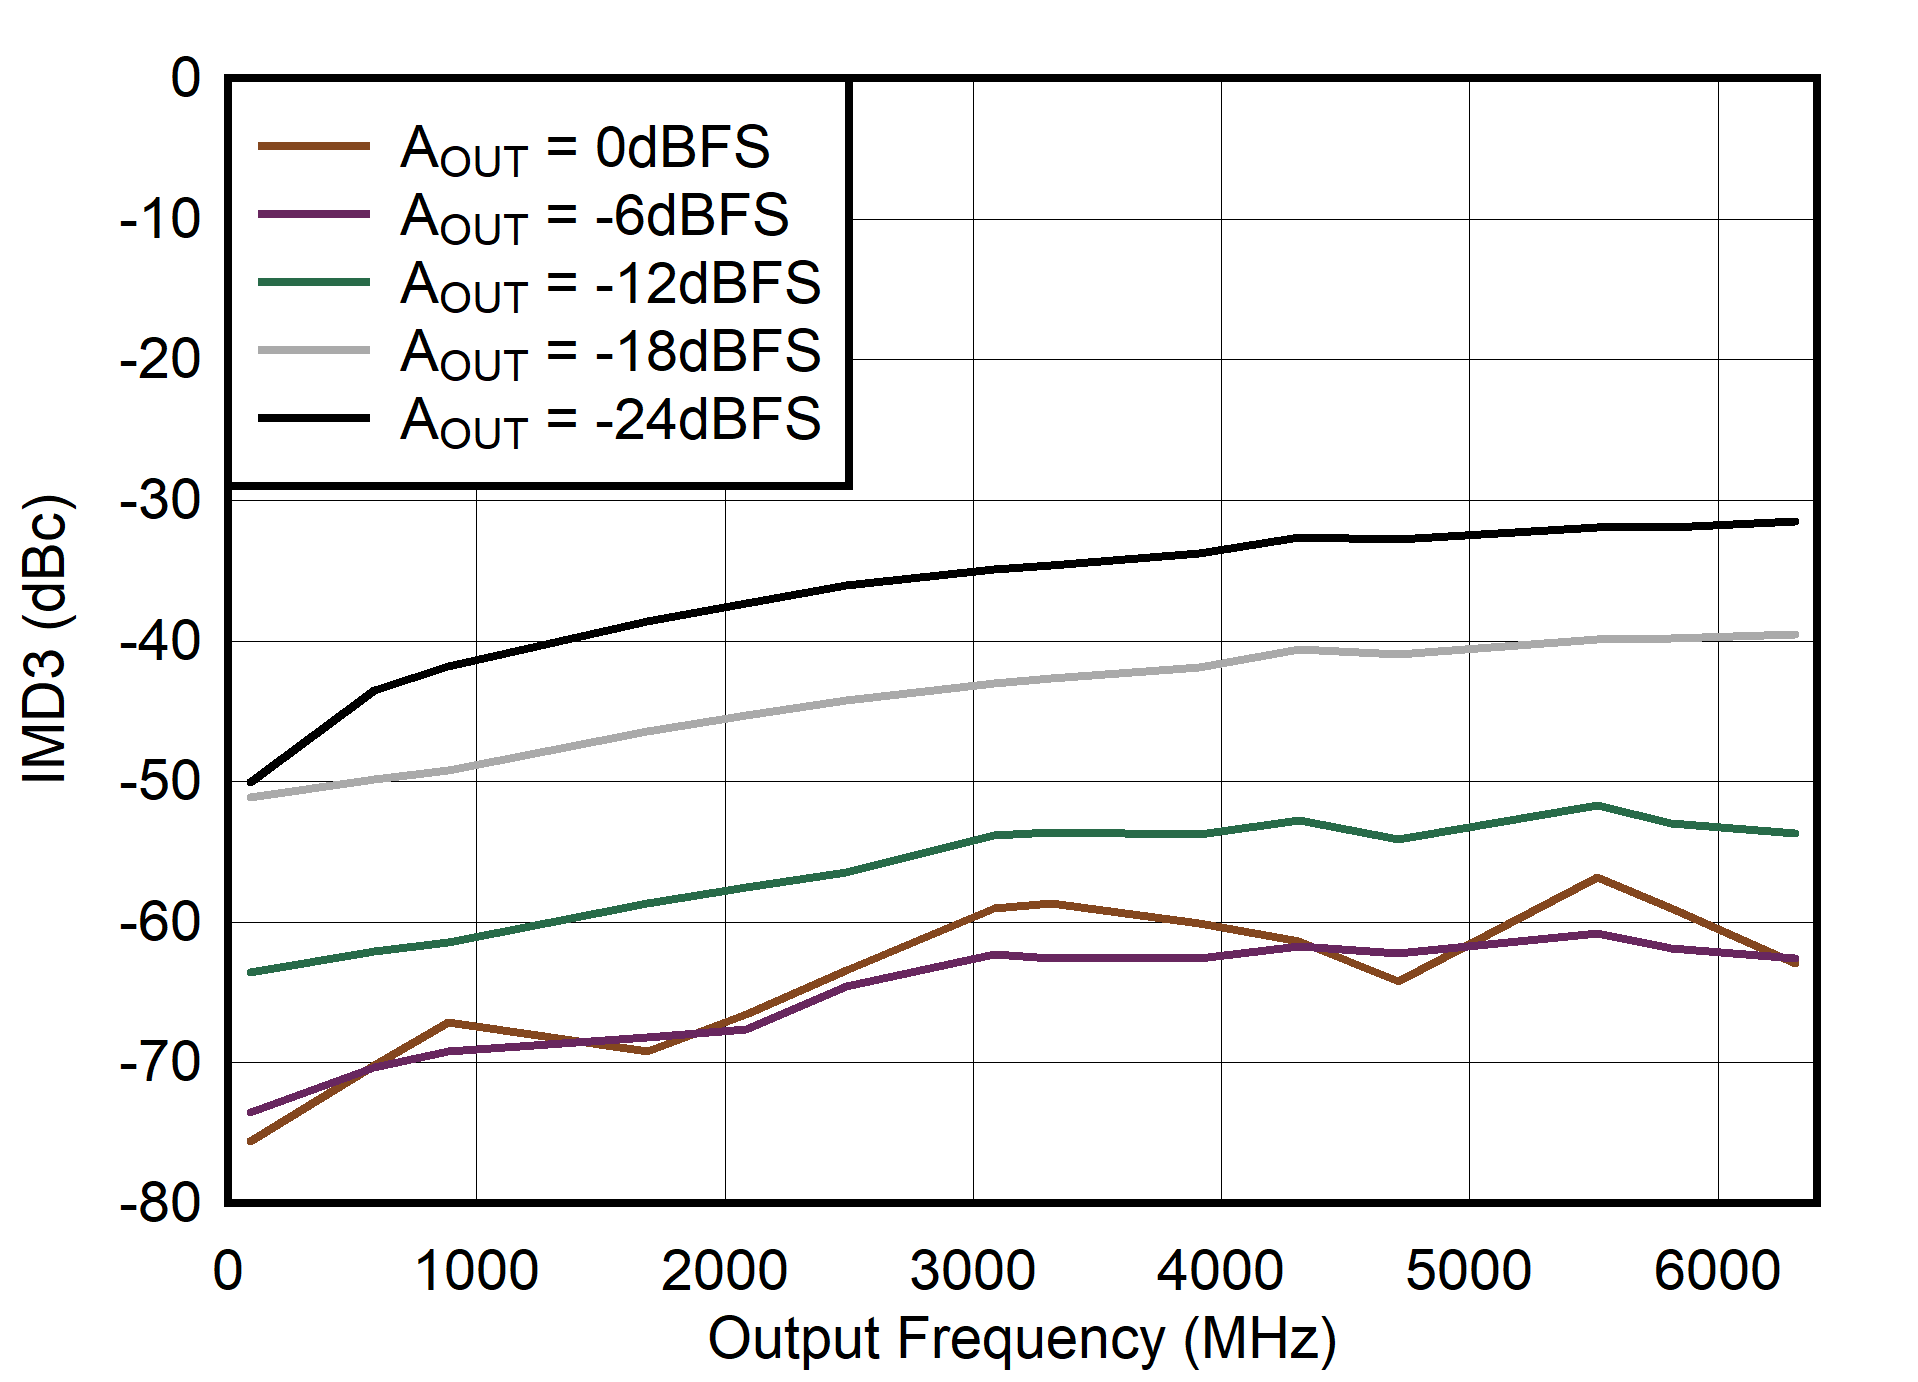
Figure 6-114 Single Channel RTZ Mode: IMD3 vs Output Frequency and Digital Level
Figure 6-116 Dual
Channel RTZ Mode: NPR vs Digital Level
Figure 6-118 Single Channel NRZ and RF Modes: NPR vs Digital Level
Figure 6-120 Single Channel NRZ Mode: Additive Phase Noise
Figure 6-122 Single Channel Mode: NSD vs Supply Voltage
Figure 6-124 Single Channel Mode: NSD vs Temperature
Figure 6-126 Dual
Channel Mode: IVDDA18 vs Sample Rate
Figure 6-128 Dual
Channel Mode: IVDDCLK18 vs Sample Rate
Figure 6-130 Dual
Channel Mode: IVDDDIG vs Sample Rate
Figure 6-132 Dual
Channel Mode: IVDDIO vs Sample Rate
Figure 6-134 Single Channel Mode: Power Dissipation vs Sample Rate
Figure 6-136 Single Channel Mode: IVDDA vs Sample Rate
Figure 6-138 Single Channel Mode: IVDDCLK vs Sample Rate
Figure 6-140 Single Channel Mode: IVDDE vs Sample Rate
Figure 6-142 Single Channel Mode: IVEE vs Sample Rate

| fCLK = 6.4 GHz, relative to NRZ mode at low frequency, ripple at > 5 GHz are due to cable reflections |

| fCLK = 6.4 GHz, relative to NRZ mode at low frequency, ripple at > 5 GHz are due to cable reflections |
| FSAMPLE = 3.2 GSPS, cable and transformer loss removed |

| fCLK = 3.2 GHz, 1st and 2nd Nyquist Zones Displayed |

| fCLK = 3.2 GHz, 1st and 2nd Nyquist Zones Displayed |

| each tone at -6 dBFS, fCLK = 3.2 GHz, 1st and 2nd Nyquist Zones Displayed |

| each tone at -6 dBFS, fCLK = 3.2 GHz, 1st and 2nd Nyquist Zones Displayed |

| fCLK = 3.2 GHz, 1st, 2nd and 3rd Nyquist Zones Displayed |

| fCLK = 3.2 GHz, 1st, 2nd and 3rd Nyquist Zones Displayed |

| each tone at -6 dBFS, fCLK = 3.2 GHz, 1st, 2nd and 3rd Nyquist Zones Displayed |

| each tone at -6 dBFS, fCLK = 3.2 GHz, 1st, 2nd and 3rd Nyquist Zones Displayed |

| fCLK = 3.2 GHz, 1st and 2nd Nyquist Zones Displayed |

| fCLK = 3.2 GHz, 1st and 2nd Nyquist Zones Displayed |

| each tone at -6 dBFS, fCLK = 3.2 GHz, 1st and 2nd Nyquist Zones Displayed |

| each tone at -6 dBFS, fCLK = 3.2 GHz, 1st and 2nd Nyquist Zones Displayed |

| fCLK = 3.2 GHz, 1st through 5th Nyquist Zones Displayed |

| fCLK = 3.2 GHz, 1st through 5th Nyquist Zones Displayed |

| each tone at -6 dBFS, fCLK = 3.2 GHz, 1st through 5th Nyquist Zones Displayed |

| each tone at -6 dBFS, fCLK = 3.2 GHz, 1st through 5th Nyquist Zones Displayed |

| fCLK = 6.4 GHz, 1st and 2nd Nyquist Zones Displayed |

| fCLK = 6.4 GHz, 1st and 2nd Nyquist Zones Displayed |

| each tone at -6 dBFS, fCLK = 6.4 GHz, 1st and 2nd Nyquist Zones Displayed |

| each tone at -6 dBFS, fCLK = 6.4 GHz, 1st and 2nd Nyquist Zones Displayed |

| fCLK = 6.4 GHz, 1st through 3rd Nyquist Zones Displayed |

| fCLK = 6.4 GHz, 1st through 3rd Nyquist Zones Displayed |

| each tone at -6 dBFS, fCLK = 6.4 GHz, 1st through 3rd Nyquist Zones Displayed |

| each tone at -6 dBFS, fCLK = 6.4 GHz, 1st through 3rd Nyquist Zones Displayed |

| fCLK = 6.4 GHz, 1st and 2nd Nyquist Zones Displayed |

| fCLK = 6.4 GHz, 1st and 2nd Nyquist Zones Displayed |

| each tone at -6 dBFS, fCLK = 6.4 GHz, 1st and 2nd Nyquist Zones Displayed |

| each tone at -6 dBFS, fCLK = 6.4 GHz, 1st and 2nd Nyquist Zones Displayed |

| fCLK = 3.2 GHz |

| fCLK = 3.2 GHz |

| fCLK = 3.2 GHz, tone spacing = 20 MHz |

| fCLK = 3.2 GHz |

| fCLK = 3.2 GHz |

| fCLK = 3.2 GHz |

| fCLK = 3.2 GHz |

| fCLK = 3.2 GHz, tone spacing = 20 MHz |

| fCLK = 3.2 GHz |

| fCLK = 3.2 GHz, 70 MHz offset |

| fCLK = 6.4 GHz |

| fCLK = 6.4 GHz |

| fCLK = 6.4 GHz, tone spacing = 20 MHz |
| fCLK = 6.4 GHz |

| fCLK = 6.4 GHz |

| fCLK = 6.4 GHz |

| fCLK = 6.4 GHz |

| fCLK = 6.4 GHz, tone spacing = 20 MHz |

| fCLK = 6.4 GHz |

| fCLK = 6.4 GHz |
| fCLK = 6.4 GHz |

| fCLK = 6.4 GHz |

| fCLK = 6.4 GHz, tone spacing = 20 MHz |

| fCLK = 6.4 GHz |

| fCLK = 6.4 GHz, 70 MHz offset |

| Signal 90% Nyquist BW, 5% notch in center, PAR = 11.4 dB, fCLK = 3.2 GHz |

| Signal 90% Nyquist BW, 5% notch in center, PAR = 11.4 dB, fCLK = 6.4 GHz |

| Signal 90% Nyquist BW, 5% notch in center, PAR = 11.4 dB, fCLK = 6.4 GHz |
| 50 MHz tone spacing, -6dBFS/tone, all supplies changed together |
| 50 MHz tone spacing, -6dBFS/tone |

| fCLK = 6.4 GHz, relative to NRZ mode at low frequency, ripple at > 5 GHz are due to cable reflections |
| FSAMPLE = 6.4GSPS, cable and transformer loss removed |

| fCLK = 6.4 GHz, relative to NRZ mode at low frequency, ripple at > 5 GHz are due to cable reflections |

| fCLK = 3.2 GHz, 1st and 2nd Nyquist Zones Displayed |

| fCLK = 3.2 GHz, 1st and 2nd Nyquist Zones Displayed |

| each tone at -6 dBFS, fCLK = 3.2 GHz, 1st and 2nd Nyquist Zones Displayed |

| each tone at -6 dBFS, fCLK = 3.2 GHz, 1st and 2nd Nyquist Zones Displayed |

| fCLK = 3.2 GHz, 1st, 2nd and 3rd Nyquist Zones Displayed |

| fCLK = 3.2 GHz, 1st, 2nd and 3rd Nyquist Zones Displayed |

| each tone at -6 dBFS, fCLK = 3.2 GHz, 1st, 2nd and 3rd Nyquist Zones Displayed |

| each tone at -6 dBFS, fCLK = 3.2 GHz, 1st, 2nd and 3rd Nyquist Zones Displayed |

| fCLK = 3.2 GHz, 1st and 2nd Nyquist Zones Displayed |

| fCLK = 3.2G Hz, 1st and 2nd Nyquist Zones Displayed |

| each tone at -6 dBFS, fCLK = 3.2 GHz, 1st and 2nd Nyquist Zones Displayed |

| each tone at -6 dBFS, fCLK = 3.2 GHz, 1st and 2nd Nyquist Zones Displayed |

| fCLK = 3.2 GHz, 1st through 5th Nyquist Zones Displayed |

| fCLK = 3.2 GHz, 1st through 5th Nyquist Zones Displayed |

| each tone at -6 dBFS, fCLK = 3.2 GHz, 1st through 5th Nyquist Zones Displayed |

| each tone at -6 dBFS, fCLK = 3.2 GHz, 1st through 5th Nyquist Zones Displayed |

| fCLK = 6.4 GHz, 1st and 2nd Nyquist Zones Displayed |

| fCLK = 6.4 GHz, 1st and 2nd Nyquist Zones Displayed |

| each tone at -6 dBFS, fCLK = 6.4 GHz, 1st and 2nd Nyquist Zones Displayed |

| each tone at -6 dBFS, fCLK = 6.4 GHz, 1st and 2nd Nyquist Zones Displayed |

| fCLK = 6.4 GHz, 1st through 3rd Nyquist Zones Displayed |

| fCLK = 6.4 GHz, 1st through 3rd Nyquist Zones Displayed |

| each tone at -6 dBFS, fCLK = 6.4 GHz, 1st through 3rd Nyquist Zones Displayed |

| each tone at -6 dBFS, fCLK = 6.4 GHz, 1st through 3rd Nyquist Zones Displayed |

| fCLK = 6.4 GHz, 1st and 2nd Nyquist Zones Displayed |

| fCLK = 6.4 GHz, 1st and 2nd Nyquist Zones Displayed |

| each tone at -6d BFS, fCLK = 6.4 GHz, 1st and 2nd Nyquist Zones Displayed |

| each tone at -6d BFS, fCLK = 6.4GHz, 1st and 2nd Nyquist Zones Displayed |

| fCLK = 3.2 GHz |

| fCLK = 3.2 GHz |

| fCLK = 3.2 GHz |

| fCLK = 3.2 GHz |

| fCLK = 3.2 GHz, tone spacing = 20 MHz |

| fCLK = 3.2 GHz |

| fCLK = 3.2 GHz, 70 MHz offset |

| fCLK = 3.2 GHz |

| fCLK = 3.2 GHz |

| fCLK = 3.2 GHz, tone spacing = 20 MHz |

| fCLK = 6.4 GHz |

| fCLK = 6.4 GHz |
| fCLK = 6.4 GHz |

| fCLK = 6.4 GHz |

| fCLK = 6.4 GHz, tone spacing = 20 MHz |

| fCLK = 6.4 GHz |

| fCLK = 6.4 GHz |

| fCLK = 6.4 GHz |

| fCLK = 6.4 GHz |

| fCLK = 6.4 GHz, tone spacing = 20 MHz |
| fCLK = 6.4 GHz |

| fCLK = 6.4 GHz, 70 MHz offset |

| fCLK = 6.4 GHz |

| fCLK = 6.4 GHz |

| fCLK = 6.4 GHz, tone spacing = 20 MHz |

| Signal 90% Nyquist BW, 5% notch in center, PAR = 11.4 dB, fCLK = 3.2 GHz |

| Signal 90% Nyquist BW, 5% notch in center, PAR = 11.4 dB, fCLK = 6.4 GHz |
| FOUT = 995 MHz, input clock phase noise removed |
| 70 MHz offset, all supplies changed together |
| 70 MHz offset |