SPRSP68B January 2023 – November 2023 TMS320F2800152-Q1 , TMS320F2800153-Q1 , TMS320F2800154-Q1 , TMS320F2800155 , TMS320F2800155-Q1 , TMS320F2800156-Q1 , TMS320F2800157 , TMS320F2800157-Q1
PRODMIX
- 1
- 1 Features
- 2 Applications
- 3 Description
- 4 Device Comparison
- 5 Pin Configuration and Functions
-
6 Specifications
- 6.1 Absolute Maximum Ratings
- 6.2 ESD Ratings – Commercial
- 6.3 ESD Ratings – Automotive
- 6.4 Recommended Operating Conditions
- 6.5 Power Consumption Summary
- 6.6 Electrical Characteristics
- 6.7 Thermal Resistance Characteristics for PN Package
- 6.8 Thermal Resistance Characteristics for PM Package
- 6.9 Thermal Resistance Characteristics for PHP Package
- 6.10 Thermal Resistance Characteristics for RHB Package
- 6.11 Thermal Design Considerations
- 6.12 Thermal Design Considerations for AEC-Q100 Grade 0
- 6.13
System
- 6.13.1
Power Management Module (PMM)
- 6.13.1.1 Introduction
- 6.13.1.2 Overview
- 6.13.1.3 External Components
- 6.13.1.4 Power Sequencing
- 6.13.1.5 Recommended Operating Conditions Applicability to the PMM
- 6.13.1.6 Power Management Module Electrical Data and Timing
- 6.13.2 Reset Timing
- 6.13.3
Clock Specifications
- 6.13.3.1 Clock Sources
- 6.13.3.2
Clock Frequencies, Requirements, and Characteristics
- 6.13.3.2.1
Input Clock Frequency and Timing
Requirements, PLL Lock Times
- 6.13.3.2.1.1 Input Clock Frequency
- 6.13.3.2.1.2 XTAL Oscillator Characteristics
- 6.13.3.2.1.3 X1 Input Level Characteristics When Using an External Clock Source - Not a Crystal
- 6.13.3.2.1.4 X1 Timing Requirements
- 6.13.3.2.1.5 AUXCLKIN Timing Requirements
- 6.13.3.2.1.6 APLL Characteristics
- 6.13.3.2.1.7 XCLKOUT Switching Characteristics - PLL Bypassed or Enabled
- 6.13.3.2.1.8 Internal Clock Frequencies
- 6.13.3.2.1
Input Clock Frequency and Timing
Requirements, PLL Lock Times
- 6.13.3.3 Input Clocks and PLLs
- 6.13.3.4 XTAL Oscillator
- 6.13.3.5 Internal Oscillators
- 6.13.4 Flash Parameters
- 6.13.5 RAM Specifications
- 6.13.6 ROM Specifications
- 6.13.7 Emulation/JTAG
- 6.13.8 GPIO Electrical Data and Timing
- 6.13.9 Interrupts
- 6.13.10
Low-Power Modes
- 6.13.10.1 Clock-Gating Low-Power Modes
- 6.13.10.2
Low-Power Mode Wake-up Timing
- 6.13.10.2.1 IDLE Mode Timing Requirements
- 6.13.10.2.2 IDLE Mode Switching Characteristics
- 6.13.10.2.3 IDLE Entry and Exit Timing Diagram
- 6.13.10.2.4 STANDBY Mode Timing Requirements
- 6.13.10.2.5 STANDBY Mode Switching Characteristics
- 6.13.10.2.6 STANDBY Entry and Exit Timing Diagram
- 6.13.10.2.7 HALT Mode Timing Requirements
- 6.13.10.2.8 HALT Mode Switching Characteristics
- 6.13.10.2.9 HALT Entry and Exit Timing Diagram
- 6.13.1
Power Management Module (PMM)
- 6.14
Analog Peripherals
- 6.14.1 Analog Pins and Internal Connections
- 6.14.2 Analog Signal Descriptions
- 6.14.3 Analog-to-Digital Converter (ADC)
- 6.14.4 Temperature Sensor
- 6.14.5
Comparator Subsystem (CMPSS)
- 6.14.5.1 CMPSS Module Variants
- 6.14.5.2 CMPx_DACL
- 6.14.5.3 CMPSS Connectivity Diagram
- 6.14.5.4 Block Diagrams
- 6.14.5.5
CMPSS Electrical Data and Timing
- 6.14.5.5.1 CMPSS Comparator Electrical Characteristics
- 6.14.5.5.2 CMPSS_LITE Comparator Electrical Characteristics
- CMPSS Comparator Input Referred Offset and Hysteresis
- 6.14.5.5.3 CMPSS DAC Static Electrical Characteristics
- 6.14.5.5.4 CMPSS_LITE DAC Static Electrical Characteristics
- 6.14.5.5.5 CMPSS Illustrative Graphs
- 6.14.5.5.6 CMPSS DAC Dynamic Error
- 6.14.5.5.7 Buffered Output from CMPx_DACL Operating Conditions
- 6.14.5.5.8 Buffered Output from CMPx_DACL Electrical Characteristics
- 6.15 Control Peripherals
- 6.16
Communications Peripherals
- 6.16.1 Controller Area Network (CAN)
- 6.16.2 Modular Controller Area Network (MCAN)
- 6.16.3 Inter-Integrated Circuit (I2C)
- 6.16.4 Power Management Bus (PMBus) Interface
- 6.16.5 Serial Communications Interface (SCI)
- 6.16.6 Serial Peripheral Interface (SPI)
- 6.16.7 Local Interconnect Network (LIN)
- 7 Detailed Description
-
8 Applications, Implementation, and Layout
- 8.1 Application and Implementation
- 8.2 Key Device Features
- 8.3
Application Information
- 8.3.1
Typical Application
- 8.3.1.1 On-Board Charger (OBC)
- 8.3.1.2 Automotive Pump
- 8.3.1.3 Positive Temperature Coefficient (PTC) Heater
- 8.3.1.4 Automotive HVAC Compressor
- 8.3.1.5 Single-Phase Line-Interactive Uninterruptable Power Supply (UPS)
- 8.3.1.6 AC Drive Power Stage Module
- 8.3.1.7 Server or Telecom Power Supply Unit (PSU)
- 8.3.1
Typical Application
- 9 Device and Documentation Support
- 10Revision History
- 11Mechanical, Packaging, and Orderable Information
Package Options
Refer to the PDF data sheet for device specific package drawings
Mechanical Data (Package|Pins)
- PM|64
- RHB|32
- PN|80
- PHP|48
Thermal pad, mechanical data (Package|Pins)
Orderable Information
6.5.4 Current Consumption Graphs
The below graphs show a typical representation of the relationship between frequency, temperature, supply, and current consumption on the device. Actual results vary based on the system implementation and conditions.
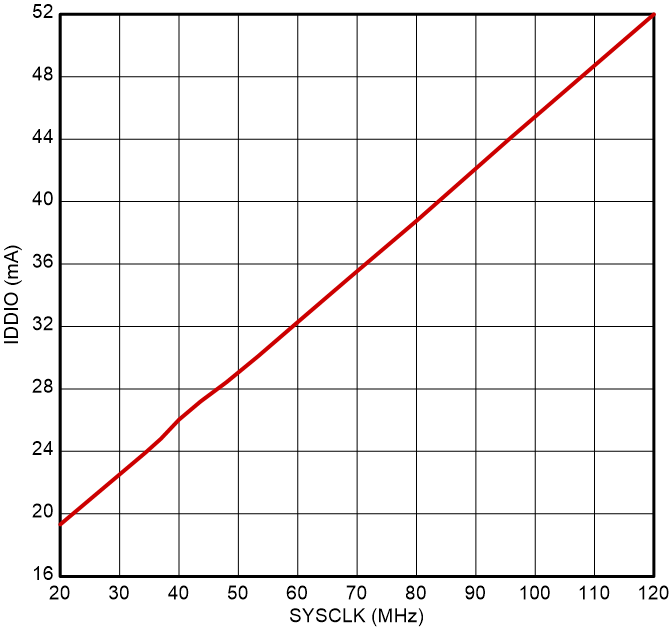
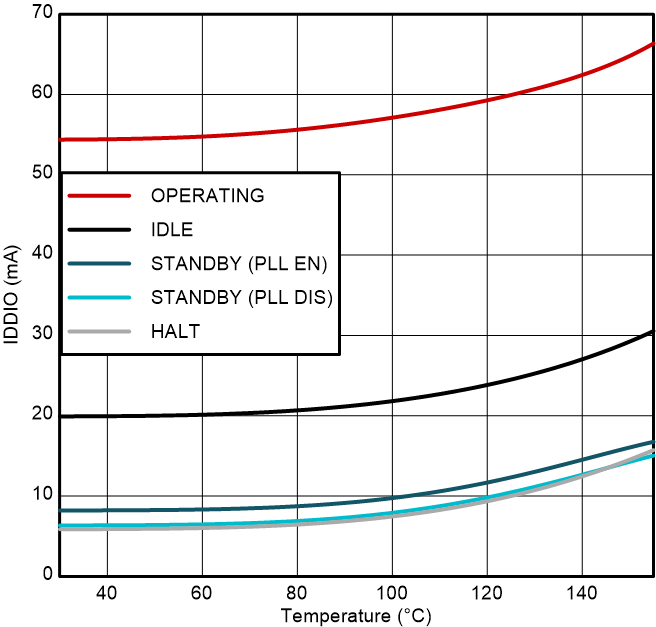
Figure 6-1 shows the typical operating current profile across frequency. Figure 6-2 shows the typical operating current profile across temperature and operating mode for internal supply, with data based on the System Current Consumption - VREG Enable - Internal Supply table (30 °C data is taken at VNOM with higher temperature data points taken at VMAX). Figure 6-3 shows the typical operating current profile across temperature and operating mode for external supply, with data based on the System Current Consumption - VREG Enable - External Supply table (30 °C data is taken at VNOM with higher temperature data points taken at VMAX).
 Figure 6-1 Operating Current Versus
Frequency
 Figure 6-3 Current Versus Temperature
- External Supply
 Figure 6-2 Current Versus Temperature
- Internal Supply