JAJSEC1C November 2019 – July 2020 ADS8686S
PRODUCTION DATA
- 1 特長
- 2 アプリケーション
- 3 概要
- 4 Revision History
- 5 Pin Configuration and Functions
-
6 Specifications
- 6.1 Absolute Maximum Ratings
- 6.2 ESD Ratings
- 6.3 Recommended Operating Conditions
- 6.4 Thermal Information
- 6.5 Electrical Characteristics
- 6.6 Timing Requirements
- 6.7 Switching Characteristics
- 6.8 Timing Diagrams: Universal
- 6.9 Timing Diagrams: Parallel Data Read
- 6.10 Timing Diagrams: Serial Data Read
- 6.11 Typical Characteristics
-
7 Detailed Description
- 7.1 Overview
- 7.2 Functional Block Diagram
- 7.3 Feature Description
- 7.4
Device Functional Modes
- 7.4.1
Device Interface: Pin Description
- 7.4.1.1 REFSEL (Input)
- 7.4.1.2 RESET (Input)
- 7.4.1.3 SEQEN (Input)
- 7.4.1.4 HW_RANGESEL[1:0] (Input)
- 7.4.1.5 SER/BYTE/PAR (Input)
- 7.4.1.6 DB[3:0] (Input/Output)
- 7.4.1.7 DB4/SER1W (Input/Output)
- 7.4.1.8 DB5/CRCEN (Input/Output)
- 7.4.1.9 DB[7:6] (Input/Output)
- 7.4.1.10 DB8 (Input/Output)
- 7.4.1.11 DB9/BYTESEL (Input/Output)
- 7.4.1.12 DB10/SDI (Input/Output)
- 7.4.1.13 DB11/SDOB (Input/Output)
- 7.4.1.14 DB12/SDOA (Input/Output)
- 7.4.1.15 DB13/OS0 (Input/Output)
- 7.4.1.16 DB14/OS1 (Input/Output)
- 7.4.1.17 DB15/OS2 (Input/Output)
- 7.4.1.18 WR/BURST (Input)
- 7.4.1.19 SCLK/RD (Input)
- 7.4.1.20 CS (Input)
- 7.4.1.21 CHSEL[2:0] (Input)
- 7.4.1.22 BUSY (Output)
- 7.4.1.23 CONVST (Input)
- 7.4.2 Device Modes of Operation
- 7.4.1
Device Interface: Pin Description
- 7.5 Programming
- 7.6 Register Maps
- 8 Application and Implementation
- 9 Power Supply Recommendations
- 10Layout
- 11Device and Documentation Support
6.11 Typical Characteristics
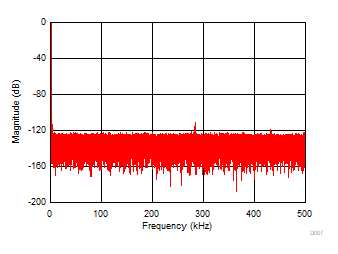
at TA = 25°C, AVDD = 5 V, DVDD = 3 V, internal reference VREF = 2.5 V, and fS = 1 MSPS (unless otherwise noted)

| Number of points = 256k, SNR = 90.73 dB, SINAD = 90.65 dB, THD = –110 dB, SFDR = 112.2 dB |
(±10 V, Normal Mode, Filter Option 1)

| Number of points = 256k, SNR = 89.03 dB, SINAD = 88.89 dB, THD = –107.25 dB, SFDR = 110.46 dB |
(±2.5 V, Normal Mode, Filter Option 1)

| Number of points = 256k, SNR = 91.93 dB, SINAD = 91.82 dB, THD = –110.04 dB, SFDR = 111.95 dB |
(±10 V, Normal Mode, Filter Option 2)

| Number of points = 256k, SNR = 84.29 dB, SINAD = 84.27 dB, THD = –110 dB, SFDR = 113.6 dB |
(±10 V, Normal Mode, Filter Option 3)

(Filter Option 1)

(Filter Option 3)

(Filter Option 2)

(Filter Option 1)

(Filter Option 3)


| Mean = –0.78, sigma = 0.7, number of hits = 256k, VIN = 0 V |


(±5 V, Across Channels)


(±10 V, Across Channels)

(±2.5 V, Across Channels)


(Filter Option 1)

(Filter Option 1)

| Number of points = 256k, SNR = 89.56 dB, SINAD = 89.47 dB, THD = –110.83 dB, SFDR = 110.69 dB |
(±5 V, Normal Mode, Filter Option 1)

| Number of points = 256k, SNR = 90.27 dB, SINAD = 90.24 dB, THD = –111.9 dB, SFDR = 116.04 dB |
(±10 V, Burst Mode, Filter Option 1)

| Number of points = 256k, SNR = 90.99 dB, SINAD = 90.87 dB, THD = –111.91 dB, SFDR = 111.1 dB |
(±5 V, Normal Mode, Filter Option 2)

| Number of points = 256k, SNR = 81.10 dB, SINAD = 81.01 dB, THD = –110.8 dB, SFDR = 113.56 dB |
(±5 V, Normal Mode, Filter Option 3)

(Filter Option 2)

(Filter Option 1)

(Filter Option 3)

(Filter Option 2)


| Mean = 0.83, sigma = 0.62, number of hits = 256k, VIN = 0 V |

| Mean = -1.91, sigma = 0.97, number of hits = 256k, VIN = 0 V |

(±10 V, Across Channels)

(±2.5 V, Across Channels)


(±5 V, Across Channels)


(±10 V)