JAJSDE6 June   2017 LMH6624-MIL

PRODUCTION DATA.  

  1. 特長
  2. アプリケーション
  3. 概要
  4. 改訂履歴
  5. Pin Configuration and Functions
  6. Specifications
    1. 6.1 Absolute Maximum Ratings
    2. 6.2 ESD Ratings
    3. 6.3 Recommended Operating Conditions
    4. 6.4 Thermal Information
    5. 6.5 Electrical Characteristics ±2.5 V
    6. 6.6 Electrical Characteristics ±6 V
    7. 6.7 Typical Characteristics
  7. Detailed Description
    1. 7.1 Overview
    2. 7.2 Feature Description
      1. 7.2.1 Bias Current Cancellation
      2. 7.2.2 Total Input Noise vs Source Resistance
      3. 7.2.3 Noise Figure
      4. 7.2.4 Low-Noise Integrator
      5. 7.2.5 High-Gain Sallen-Key Active Filters
      6. 7.2.6 Low-Noise Magnetic Media Equalizer
    3. 7.3 Device Functional Modes
      1. 7.3.1 Single Supply Operation
  8. Application and Implementation
    1. 8.1 Application Information
    2. 8.2 Typical Application
      1. 8.2.1 Design Requirements
      2. 8.2.2 Detailed Design Procedure
      3. 8.2.3 Application Curve
  9. Power Supply Recommendations
  10. 10Layout
    1. 10.1 Layout Guidelines
    2. 10.2 Layout Example
  11. 11デバイスおよびドキュメントのサポート
    1. 11.1 ドキュメントのサポート
      1. 11.1.1 関連資料
    2. 11.2 ドキュメントの更新通知を受け取る方法
    3. 11.3 コミュニティ・リソース
    4. 11.4 商標
    5. 11.5 静電気放電に関する注意事項
    6. 11.6 Glossary
  12. 12メカニカル、パッケージ、および注文情報

パッケージ・オプション

メカニカル・データ(パッケージ|ピン)
  • Y|0
サーマルパッド・メカニカル・データ
発注情報

Specifications

Absolute Maximum Ratings

over operating free-air temperature range (unless otherwise noted)(1)
MIN MAX UNIT
VIN differential ±1.2 V
Supply voltage (V+ – V) 13.2 V
Voltage at input pins V+ +0.5,
V –0.5
V
Input current ±10 mA
Soldering information Infrared or convection (20 s) 235 °C
Wave soldering (10 s) 260 °C
Junction temperature(2) 150 °C
Storage temperature –65 150 °C

ESD Ratings

VALUE UNIT
V(ESD) Electrostatic discharge Human-body model (HBM), per ANSI/ESDA/JEDEC JS-001(1) ±2000 V
Machine model(2) ±200
Human body model, 1.5 kΩ in series with 100 pF. JEDEC document JEP155 states that 2000-V HBM allows safe manufacturing with a standard ESD control process. Manufacturing with less than 2000-V HBM is possible with the necessary precautions. Pins listed as ±2000 V may actually have higher performance.
Machine model, 0 Ω in series with 200 pF. JEDEC document JEP157 states that 200-V MM allows safe manufacturing with a standard ESD control process.

Recommended Operating Conditions

over operating free-air temperature range (unless otherwise noted)(1)
MIN MAX UNIT
Operating temperature(2) –40 +125 °C
Operating supply voltage (V+ – V–) ±2.25 ±6.3 V

Thermal Information

THERMAL METRIC(1) LMH6624-MIL UNIT
DBV D
5 PINS 8 PINS
RθJA Junction-to-ambient thermal resistance(2) 265 166 °C/W
For more information about traditional and new thermal metrics, see the IC Package Thermal Metrics application report, SPRA953.
The maximum power dissipation is a function of TJ(MAX), RθJA, and TA. The maximum allowable power dissipation at any ambient temperature is PD = (TJ(MAX) – TA)/ RθJA . All numbers apply for packages soldered directly onto a PC board.

Electrical Characteristics ±2.5 V

Unless otherwise specified, all limits ensured at TA = 25°C, V+ = 2.5 V, V = –2.5 V, VCM = 0 V, AV = +20, RF = 500 Ω,
RL = 100 Ω. See (9).
PARAMETER TEST CONDITIONS MIN(4) TYP(3) MAX(4) UNIT
DYNAMIC PERFORMANCE
fCL –3-dB BW VO = 400 mVPP 90 MHz
SR Slew rate(6) VO = 2 VPP, AV = +20 300 V/μs
VO = 2 VPP, AV = +10 360
tr Rise time VO = 400 mV Step, 10% to 90% 4.1 ns
tf Fall time VO = 400 mV Step, 10% to 90% 4.1 ns
ts Settling time 0.1% VO = 2 VPP (Step) 20 ns
DISTORTION and NOISE RESPONSE
en Input referred voltage noise f = 1 MHz 0.92 nV/√Hz
1.0
in Input referred current noise f = 1 MHz 2.3 pA/√Hz
HD2 2nd harmonic distortion fC = 10 MHz, VO = 1 VPP, RL 100 Ω –60 dBc
HD3 3rd harmonic distortion fC = 10 MHz, VO = 1 VPP, RL 100 Ω –76 dBc
INPUT CHARACTERISTICS
VOS Input offset voltage VCM = 0 V –0.75 –0.25 +0.75 mV
–40°C ≤ TJ ≤ 125°C –0.95 +0.95
Average drift(5) VCM = 0 V ±0.25 μV/°C
IOS Input offset current VCM = 0 V –1.5 –0.05 +1.5 μA
–40°C ≤ TJ ≤ 125°C –2.0 +2.0
Average drift(5) VCM = 0 V 2 nA/°C
IB Input bias current VCM = 0 V 13 +20 μA
–40°C ≤ TJ ≤ 125°C +25
Average drift(5) VCM = 0 V 12 nA/°C
RIN Input resistance(7) Common Mode 6.6
Differential Mode 4.6
CIN Input capacitance(7) Common Mode 0.9 pF
Differential Mode 2.0
CMRR Common-mode rejection ratio Input referred, VCM = –0.5 V to +1.9 V 87 90 dB
Input referred,
VCM = –0.5 V to +1.75 V
–40°C ≤ TJ ≤ 125°C 85
TRANSFER CHARACTERISTICS
AVOL Large signal voltage gain RL = 100 Ω, VO = –1 V to +1 V 75 79 dB
–40°C ≤ TJ ≤ 125°C 70
OUTPUT CHARACTERISTICS
VO Output swing RL = 100 Ω ±1.1 ±1.5 V
–40°C ≤ TJ ≤ 125°C ±1.0
No load ±1.4 ±1.7
–40°C ≤ TJ ≤ 125°C ±1.25
RO Output impedance f ≤ 100 KHz 10
ISC Output short circuit current Sourcing to ground
ΔVIN = 200 mV (2)(8)
90 145 mA
–40°C ≤ TJ ≤ 125°C 75
Sinking to ground
ΔVIN = –200 mV (2)(8)
90 145
–40°C ≤ TJ ≤ 125°C 75
IOUT Output current Sourcing, VO = +0.8 V
Sinking, VO = –0.8 V
100 mA
POWER SUPPLY
PSRR Power supply rejection ratio VS = ±2 V to ±3 V 82 90 dB
–40°C ≤ TJ ≤ 125°C 80
IS Supply current (per channel) No load 11.4 16 mA
–40°C ≤ TJ ≤ 125°C 18

Electrical Characteristics ±6 V

Unless otherwise specified, all limits ensured at TA = 25°C, V+ = 6 V, V = –6 V, VCM = 0 V, AV = +20, RF = 500 Ω,
RL = 100 Ω. See (9).
PARAMETER TEST CONDITIONS MIN(4) TYP(3) MAX(4) UNIT
DYNAMIC PERFORMANCE
fCL –3-dB BW VO = 400 mVPP 95 MHz
SR Slew rate(6) VO = 2 VPP, AV = +20 350 V/μs
VO = 2 VPP, AV = +10 400
tr Rise time VO = 400 mV Step, 10% to 90% 3.7 ns
tf Fall time VO = 400 mV Step, 10% to 90% 3.7 ns
ts Settling time 0.1% VO = 2 VPP (Step) 18 ns
DISTORTION and NOISE RESPONSE
en Input referred voltage noise f = 1 MHz 0.92 nV/√Hz
in Input referred current noise f = 1 MHz 2.3 pA/√Hz
HD2 2nd harmonic distortion fC = 10 MHz, VO = 1 VPP, RL = 100 Ω –63 dBc
HD3 3rd harmonic distortion fC = 10 MHz, VO = 1 VPP, RL = 100 Ω –80 dBc
INPUT CHARACTERISTICS
VOS Input offset voltage VCM = 0 V –0.5 ±0.10 +0.5 mV
–40°C ≤ TJ ≤ 125°C –0.7 +0.7
Average drift(5) VCM = 0 V ±0.2 μV/°C
IOS Input offset current VCM = 0 V –1.1 0.05 1.1 μA
–40°C ≤ TJ ≤ 125°C –2.5 2.5
Average drift(5) VCM = 0 V 0.7 nA/°C
IB Input bias current VCM = 0 V 13 +20 μA
–40°C ≤ TJ ≤ 125°C +25
Average drift(5) VCM = 0 V 12 nA/°C
RIN Input resistance(7) Common Mode 6.6
Differential Mode 4.6
CIN Input capacitance(7) Common Mode 0.9 pF
Differential Mode 2.0
CMRR Common-mode rejection ratio Input referred, VCM = –4.5 V to +5.25 V 90 95 dB
Input referred,
VCM = –4.5 V to +5 V
–40°C ≤ TJ ≤ 125°C 87
TRANSFER CHARACTERISTICS
AVOL Large signal voltage gain RL = 100 Ω, VO = –3 V to +3 V 77 81 dB
–40°C ≤ TJ ≤ 125°C 72
OUTPUT CHARACTERISTICS
VO Output swing RL = 100 Ω ±4.4 ±4.9 V
–40°C ≤ TJ ≤ 125°C ±4.3
No load ±4.8 ±5.2
–40°C ≤ TJ ≤ 125°C ±4.65
RO Output impedance f ≤ 100 KHz 10
ISC Output short circuit current Sourcing to ground
ΔVIN = 200 mV (2)(8)
100 156 mA
–40°C ≤ TJ ≤ 125°C 85
Sinking to ground
ΔVIN = –200 mV (2)(8)
100 156
–40°C ≤ TJ ≤ 125°C 85
IOUT Output current Sourcing, VO = +4.3 V
Sinking, VO = –4.3 V
100 mA
POWER SUPPLY
PSRR Power supply rejection ratio VS = ±5.4 V to ±6.6 V 82 88 dB
–40°C ≤ TJ ≤ 125°C 80
IS Supply current (per channel) No load 12 16 mA
–40°C ≤ TJ ≤ 125°C 18
Absolute maximum ratings indicate limits beyond which damage to the device may occur. Operating Ratings indicate conditions for which the device is intended to be functional, but specific performance is not ensured. For ensured specifications and the test conditions, see the Electrical Characteristics.
Applies to both single-supply and split-supply operation. Continuous short circuit operation at elevated ambient temperature can result in exceeding the maximum allowed junction temperature of 150°C.
Typical Values represent the most likely parametric norm.
All limits are specified by testing or statistical analysis.
Average drift is determined by dividing the change in parameter at temperature extremes into the total temperature change.
Slew rate is the slowest of the rising and falling slew rates.
Simulation results.
Short circuit test is a momentary test. Output short circuit duration is 1.5 ms.
Electrical table values apply only for factory testing conditions at the temperature indicated. Factory testing conditions result in very limited self-heating of the device such that TJ = TA. No ensured specification of parametric performance is indicated in the electrical tables under conditions of internal self-heating where TJ > TA. Absolute maximum ratings indicate junction temperature limits beyond which the device may be permanently degraded, either mechanically or electrically.
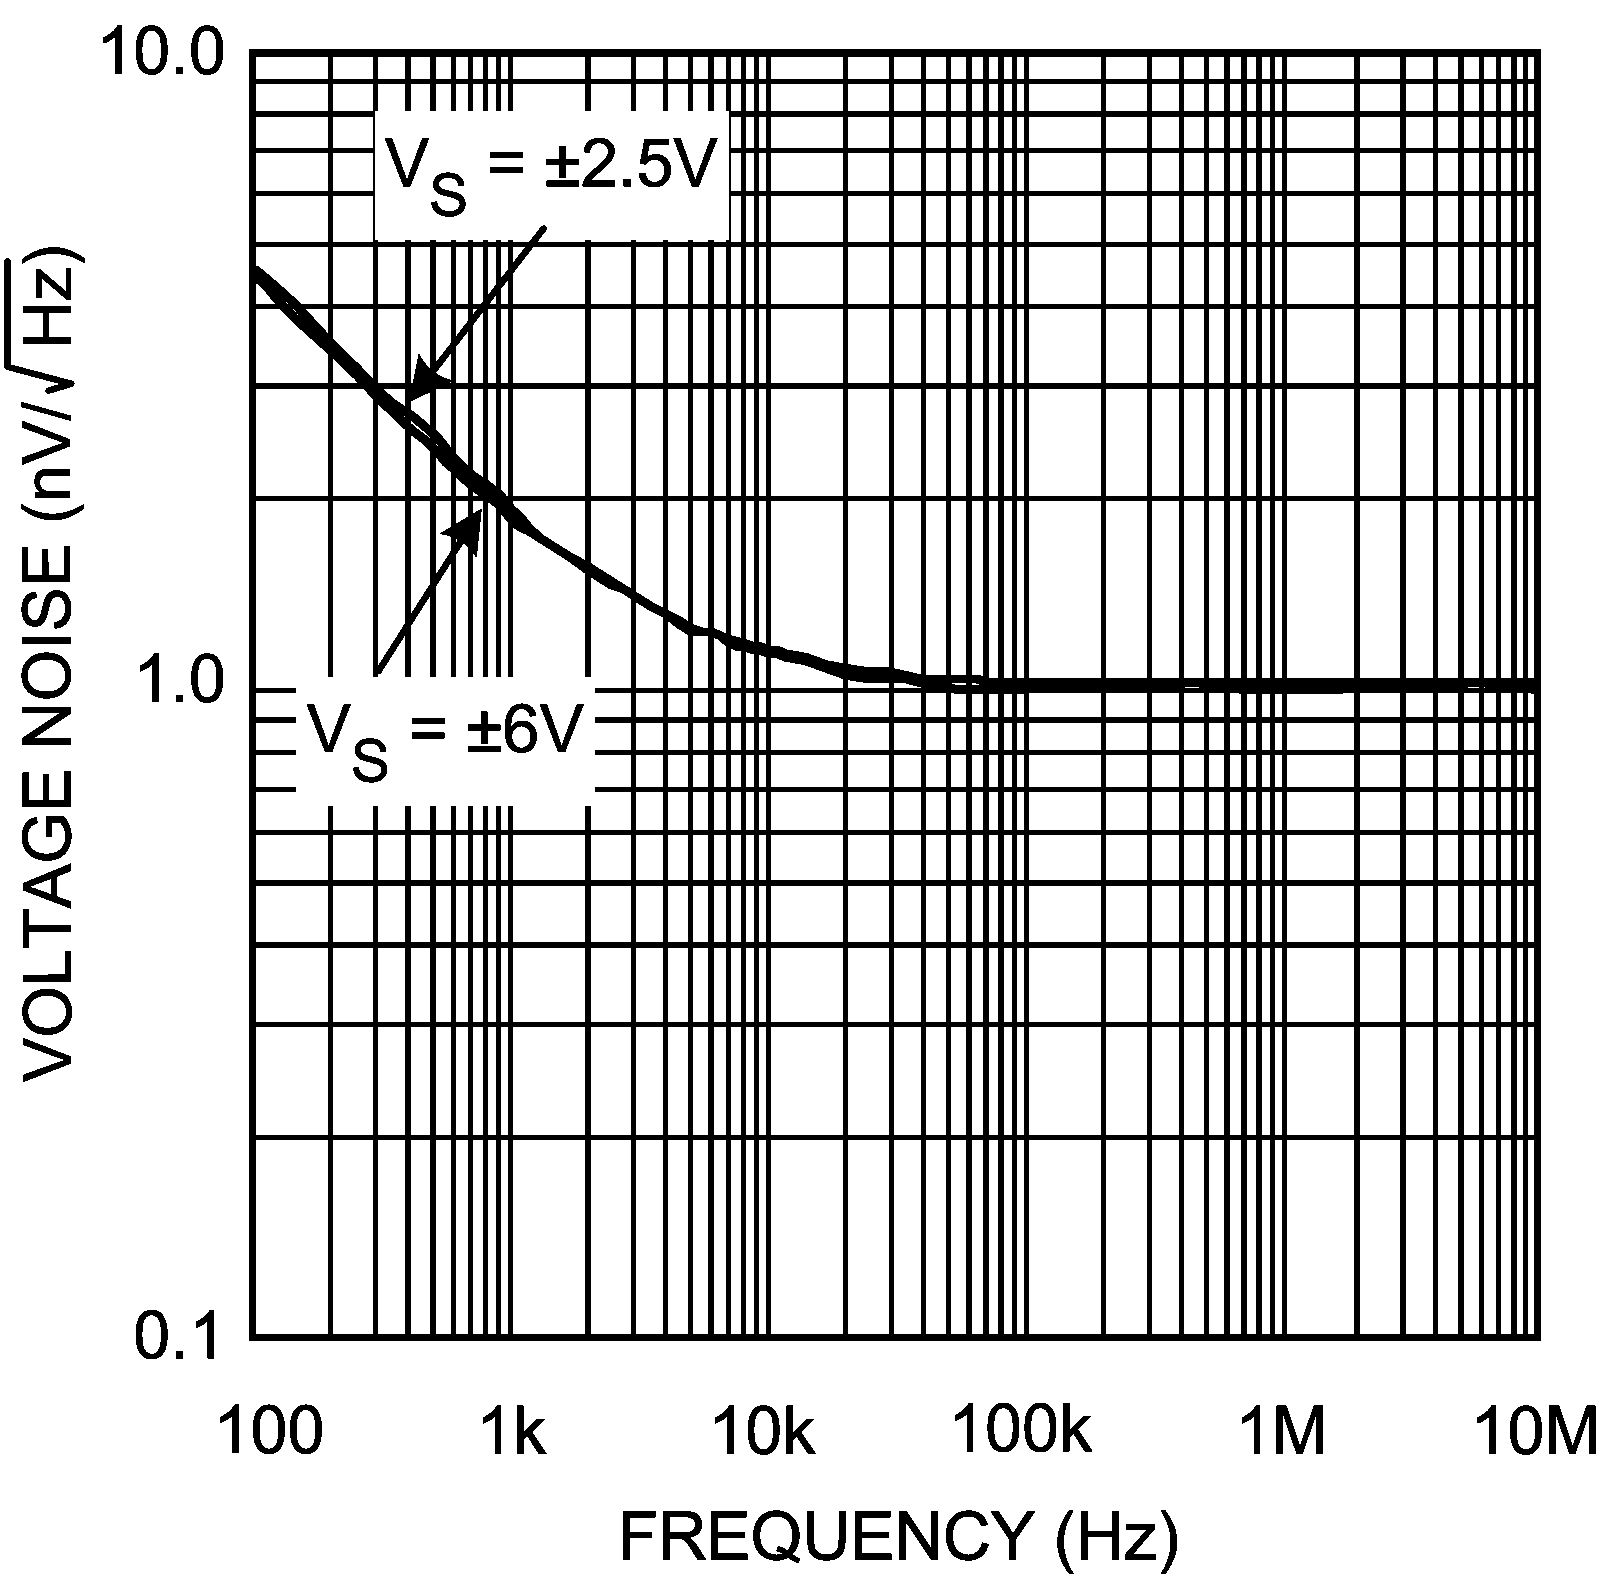
Typical Characteristics

LMH6624-MIL 20058962.png
Figure 1. Voltage Noise vs Frequency
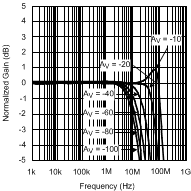
LMH6624-MIL 20058989.gif
VS = ±2.5 V
VIN = 5 mVpp
RL = 100 Ω
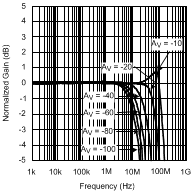
Figure 3. Inverting Frequency Response
LMH6624-MIL 20058904.gif
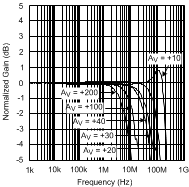
VS = ±2.5 V
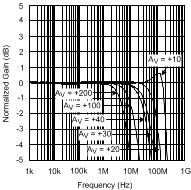
RF = 500 Ω
VO = 2 Vpp
Figure 5. Non-Inverting Frequency Response
LMH6624-MIL 20058966.gif
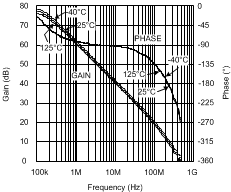
VS = ±2.5 V
Figure 7. Open Loop Frequency Response
Over Temperature
LMH6624-MIL 20058984.gif
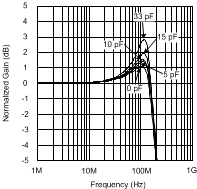
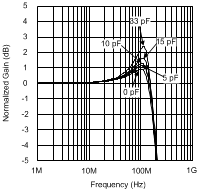
VS = ±2.5V RISO = 10 Ω
AV = +10 RL = 1 kΩ||CL
RF = 250 Ω
Figure 9. Frequency Response with Cap. Loading
LMH6624-MIL 20058987.gif
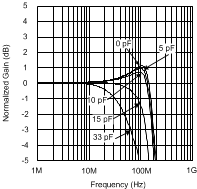
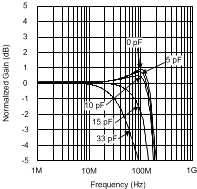
VS = ±2.5 V RISO = 100 Ω
AV = +10 RL = 1 kΩ||CL
RF = 250 Ω
Figure 11. Frequency Response with Cap. Loading
LMH6624-MIL 20058906.gif
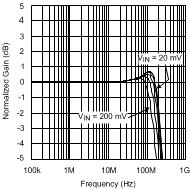
VS = ±-2.5 V
AV = +10
RF = 500 Ω
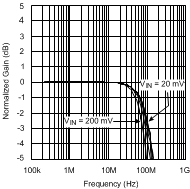
Figure 13. Non-Inverting Frequency Response Varying VIN
LMH6624-MIL 20058908.gif
VS = ±2.5 V
AV = +20
RF = 500 Ω
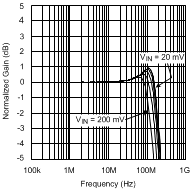
Figure 15. Non-Inverting Frequency Response Varying VIN
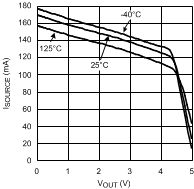
LMH6624-MIL 20058957.gif
VS = ±2.5 V
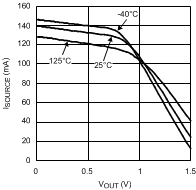
Figure 17. Sourcing Current vs VOUT
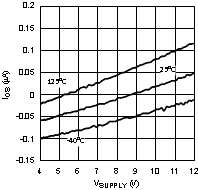
LMH6624-MIL 20058967.gif
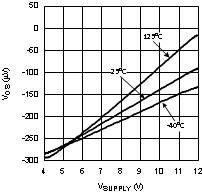
Figure 19. VOS vs VSUPPLY
LMH6624-MIL 20058956.gif
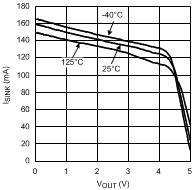
VS = ±6 V
Figure 21. Sinking Current vs VOUT
LMH6624-MIL 20058944.gif
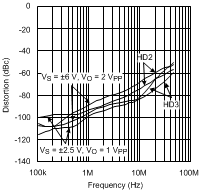
AV = +10
RL = 100 Ω
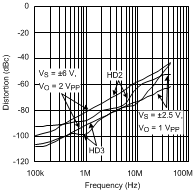
Figure 23. Distortion vs Frequency
LMH6624-MIL 20058945.gif
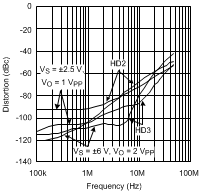
AV = +20
RL = 500 Ω
Figure 25. Distortion vs Frequency
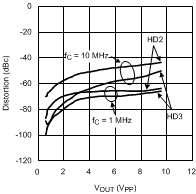
LMH6624-MIL 20058943.gif
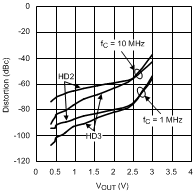
AV = +20
AV = ±2.5V
RL = 100 Ω
Figure 27. Distortion vs VOUT Peak to Peak
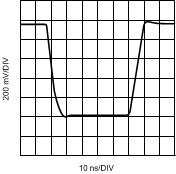
LMH6624-MIL 20058973.gif
VS = ±2.5 V RL = 100 Ω
VO = 1 Vpp
AV = +10
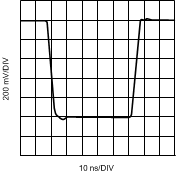
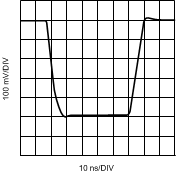
Figure 29. Non-Inverting Large Signal Pulse Response
LMH6624-MIL 20058975.gif
VS = ±2.5 V RL = 100 Ω
VO = 200 mv
AV = +10
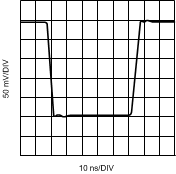
Figure 31. Non-Inverting Small Signal Pulse Response
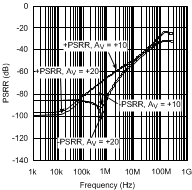
LMH6624-MIL 20058948.gif
VS = ±2.5 V
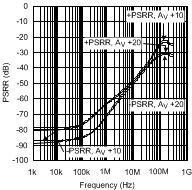
Figure 33. PSRR vs Frequency
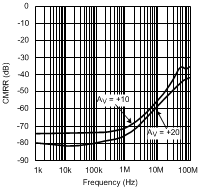
LMH6624-MIL 20058901.gif
VS = ±2.5V
VIN = 5 mVpp
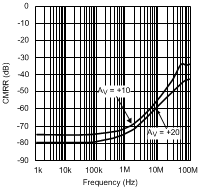
Figure 35. Input Referred CMRR vs Frequency
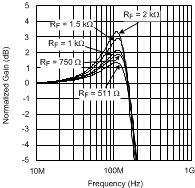
LMH6624-MIL 20058983.gif
VS = ±2.5 V
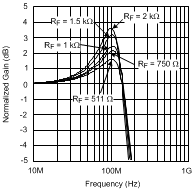
AV = +10
RL = 100 Ω
Figure 37. Amplifier Peaking with Varying RF
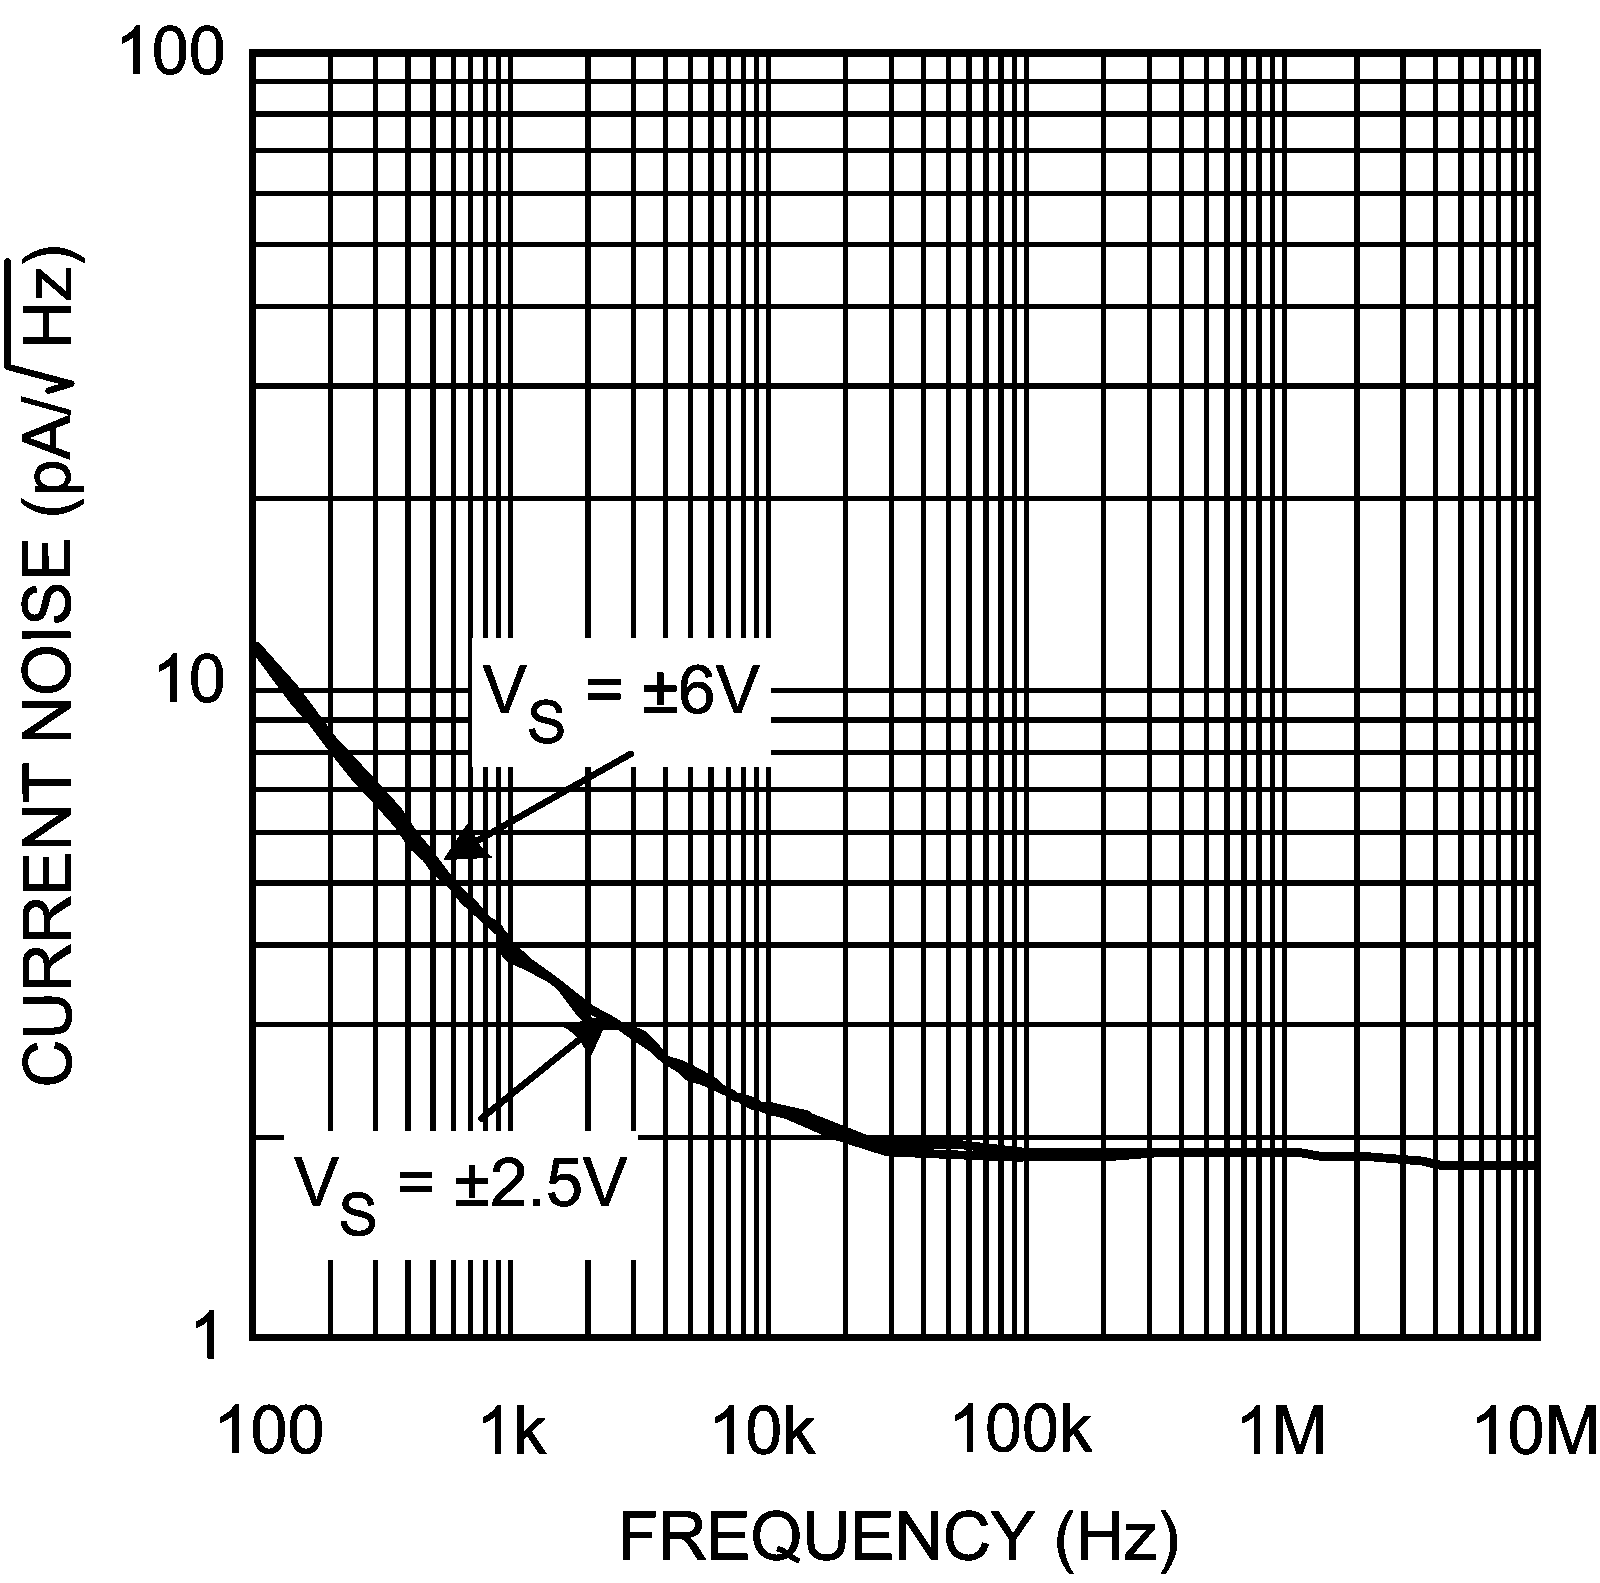
LMH6624-MIL 20058963.png
Figure 2. Current Noise vs Frequency
LMH6624-MIL 20058988.gif
VS = ±6V
VIN = 5 mVpp
RL = 100 Ω
Figure 4. Inverting Frequency Response
LMH6624-MIL 20058903.gif
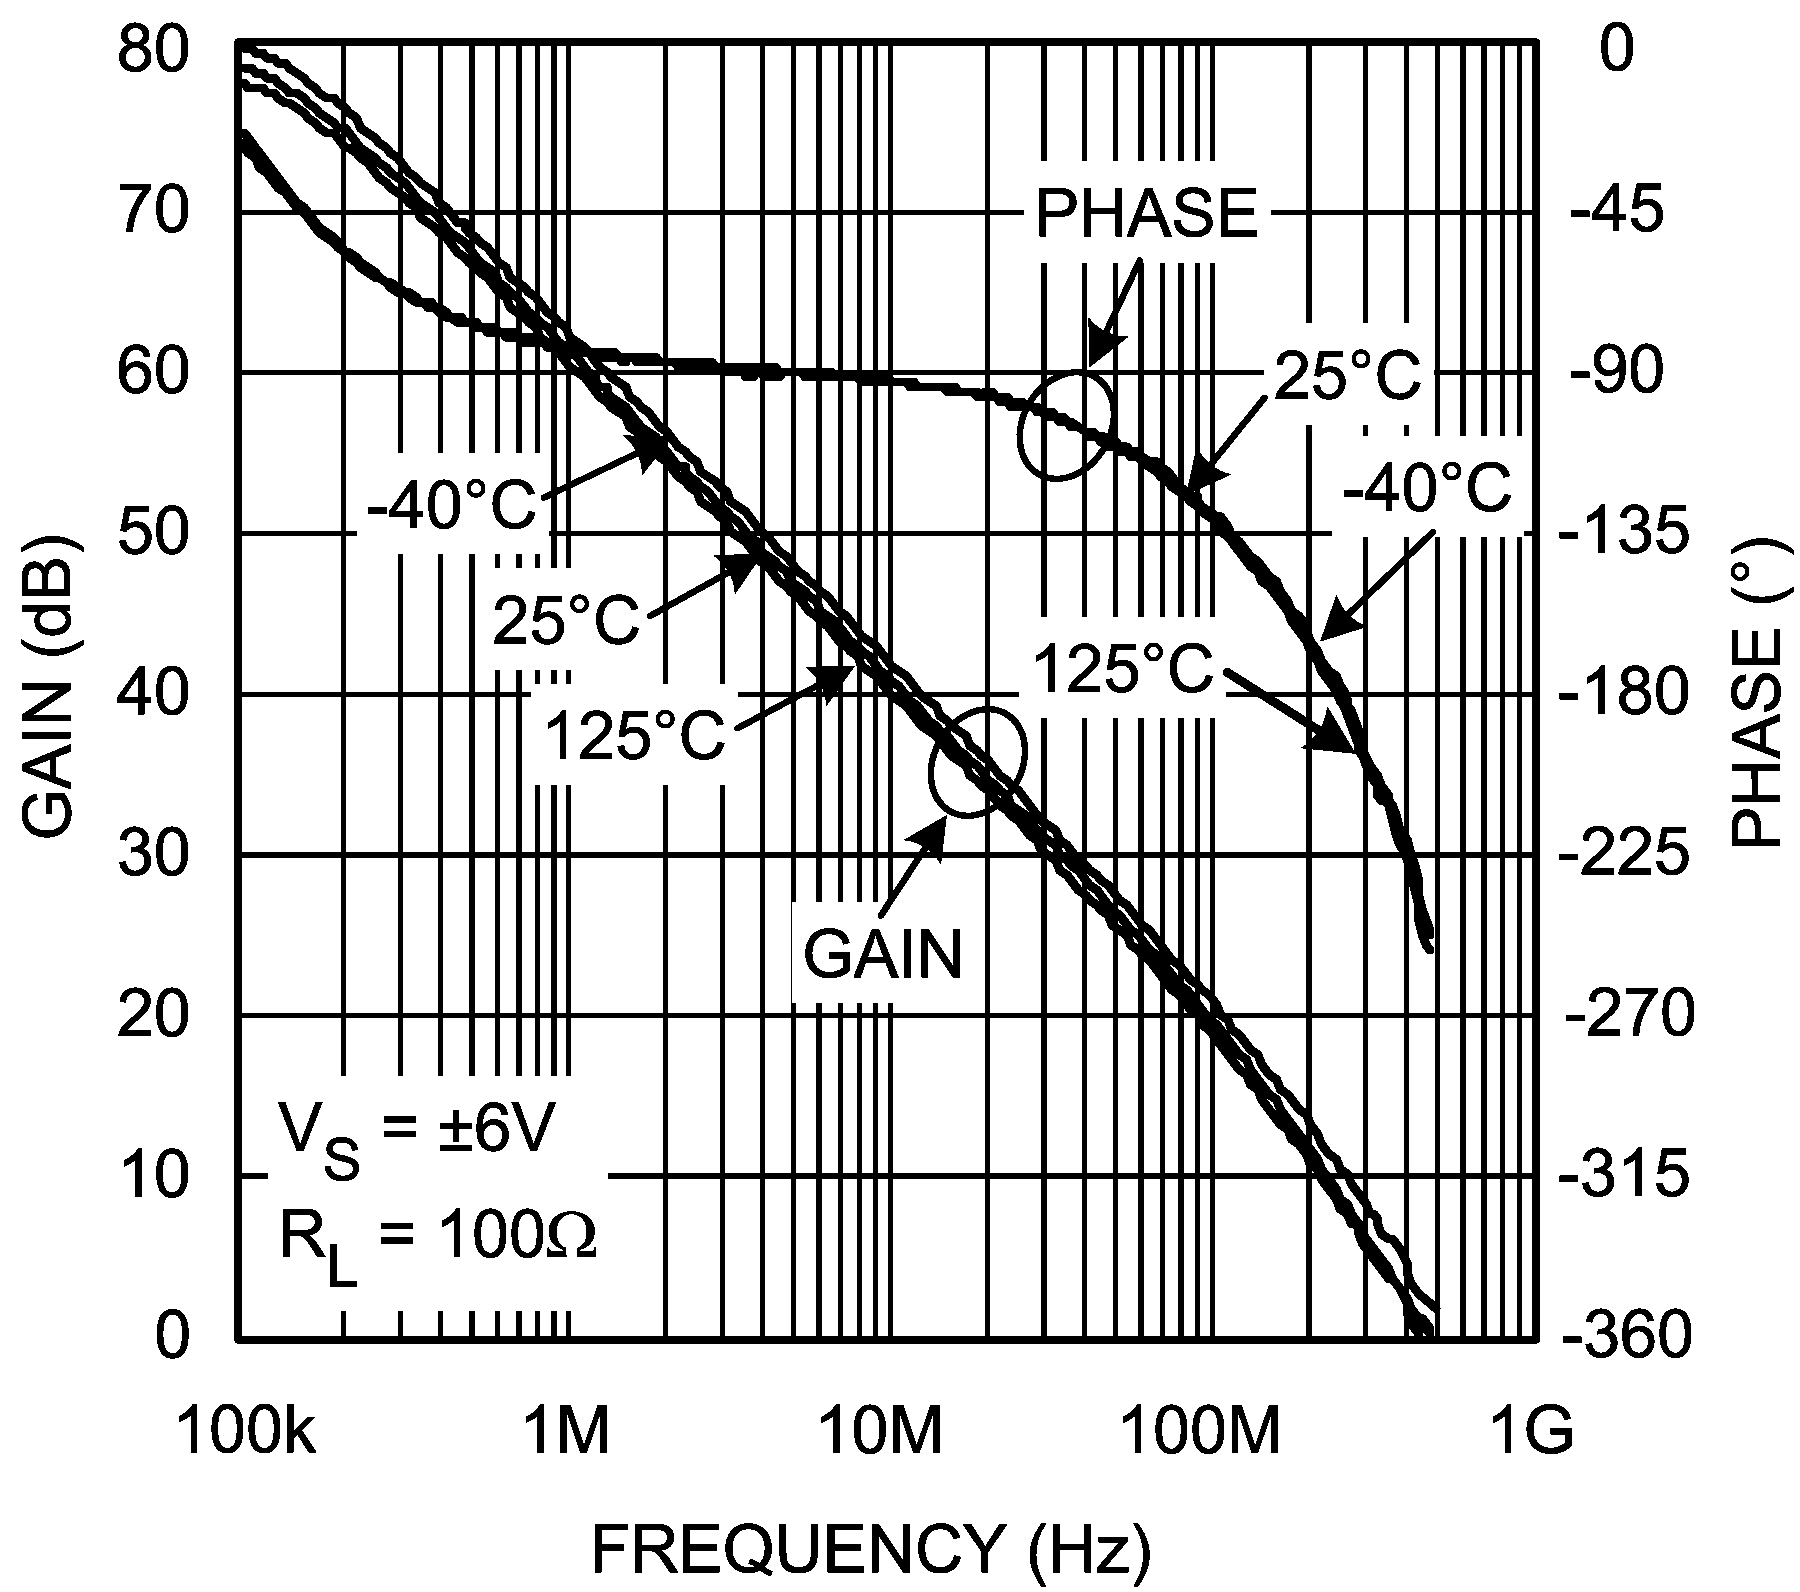
VS = ±6 V
RF = 500 Ω
VO = 2 Vpp
Figure 6. Non-Inverting Frequency Response
LMH6624-MIL 20058964.png
VS = ±6V
RL = 100 Ω
Figure 8. Open Loop Frequency Response
Over Temperature
LMH6624-MIL 20058986.gif
VS = ±6V RISO = 10 Ω
AV = +10 RL = 1 kΩ||CL
RF = 250 Ω
Figure 10. Frequency Response with Cap. Loading
LMH6624-MIL 20058985.gif
VS = ±6 V RISO = 10 Ω
AV = +10 RL = 1 kΩ||CL
RF = 250 Ω
Figure 12. Frequency Response with Cap. Loading
LMH6624-MIL 20058905.gif
VS = ±6 V
AV = +10
RF = 500 Ω
Figure 14. Non-Inverting Frequency Response Varying VIN
LMH6624-MIL 20058907.gif
VS = ±6 V
AV = +20
RF = 500 Ω
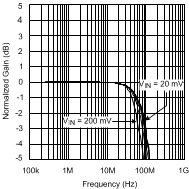
Figure 16. Non-Inverting Frequency Response Varying VIN
LMH6624-MIL 20058954.gif
VS = ±6 V
Figure 18. Sourcing Current vs VOUT
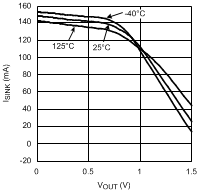
LMH6624-MIL 20058958.gif
VS = ±2.5 V
Figure 20. Sinking Current vs VOUT
LMH6624-MIL 20058953.gif
Figure 22. IOS vs VSUPPLY
LMH6624-MIL 20058946.gif
AV = +20
RL = 100 Ω
Figure 24. Distortion vs Frequency
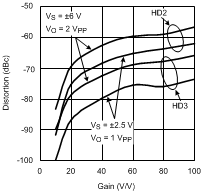
LMH6624-MIL 20058978.gif
VS = ±6 V
VO = 2 Vpp
Figure 26. Distortion vs Gain
LMH6624-MIL 20058977.gif
AV = +20
VS = ±6 V
RL = 100 Ω
Figure 28. Distortion vs VOUT Peak to Peak
LMH6624-MIL 20058974.gif
VS = ±6 V RL = 100 Ω
VO = 1 Vpp
AV = +20
Figure 30. Non-Inverting Large Signal Pulse Response
LMH6624-MIL 20058976.gif
VS = ±6 V RL = 100 Ω
VO = 500 mv
AV = +20
Figure 32. Non-Inverting Small Signal Pulse Response
LMH6624-MIL 20058949.gif
VS = ±6 V
Figure 34. PSRR vs Frequency
LMH6624-MIL 20058902.gif
VS = ±6 V
VIN = 5 mVpp
Figure 36. Input Referred CMRR vs Frequency
LMH6624-MIL 20058982.gif
VS = ±6 V
AV = +10 V
RL = 100 Ω
Figure 38. Amplifier Peaking with Varying RF