JAJSIO1B December 2013 – March 2020 TPS22966-Q1
PRODUCTION DATA.
- 1 特長
- 2 アプリケーション
- 3 概要
- 4 改訂履歴
- 5 Pin Configuration and Functions
- 6 Specifications
- 7 Parameter Measurement Information
- 8 Detailed Description
- 9 Application and Implementation
- 10Power Supply Recommendations
- 11Layout
- 12デバイスおよびドキュメントのサポート
- 13メカニカル、パッケージ、および注文情報
9.1.4 Safe Operating Area (SOA)
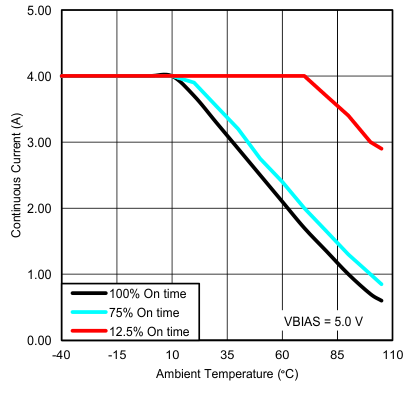
The SOA curves in Figure 33 show the continuous current carrying capability of the device versus ambient temperature (TA) to ensure reliable operation over 100,000 hours of device lifetime. Each curve represents a specific percent of time that the switch is on.
The 100% curve represents use for a full 24 hours in a day. The 75% curve indicates 18 hours of use in a day while the 12.5% curve shows 3 hours of use per day.
Examples on how to use this plot:
- The application has an ambient temperature of 60°C and the switch will be on 100% of the time. The maximum continuous current that can be applied is approximately 2.1 A.
- The application requires the switch to be on 12.5% of the time and the current while on will be 3 A. The maximum ambient temperature is approximately 100°C.
- The application requires 2 A and will be operated at 70°C. The switch can be on for a maximum of 75% of the time.
- It is expected that most applications will not have specific use cases as defined in the examples above. Different use cases can be combined to generate a more complete view of a specific application. This example shows use under various conditions simplified to an average use case. The application requires operation at 4 A for 25% of the time, 1 A for 25% of the time and is off the remaining 50% of the time. Ambient temperature will vary from 25°C to 50°C. Will there be any limitations? The average current can be calculated as (4 A × 25% + 1 A * 25% + 0 A * 50%). The average current calculates to be 1.25 A. Assuming worst case temperature of 50°C, the resulting application is within the safe operating area.
 Figure 33. Safe Operating Area