SLOA313 May 2021 AFE7070 , AFE7071
2.4 Variation Over Temperature
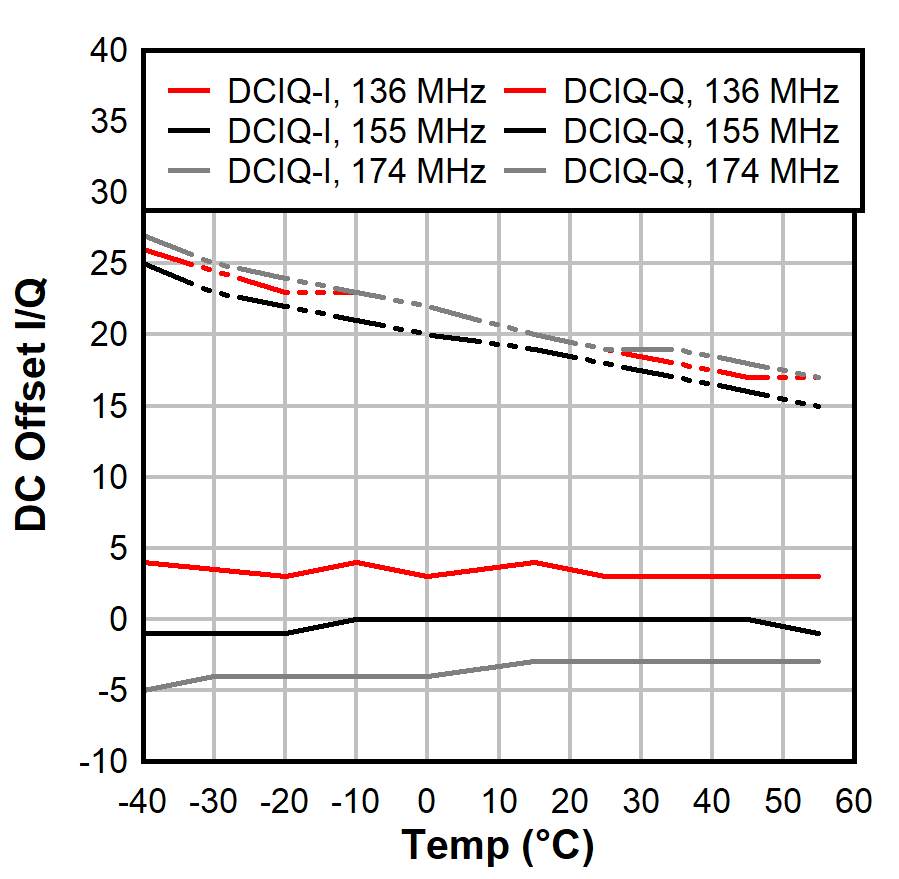
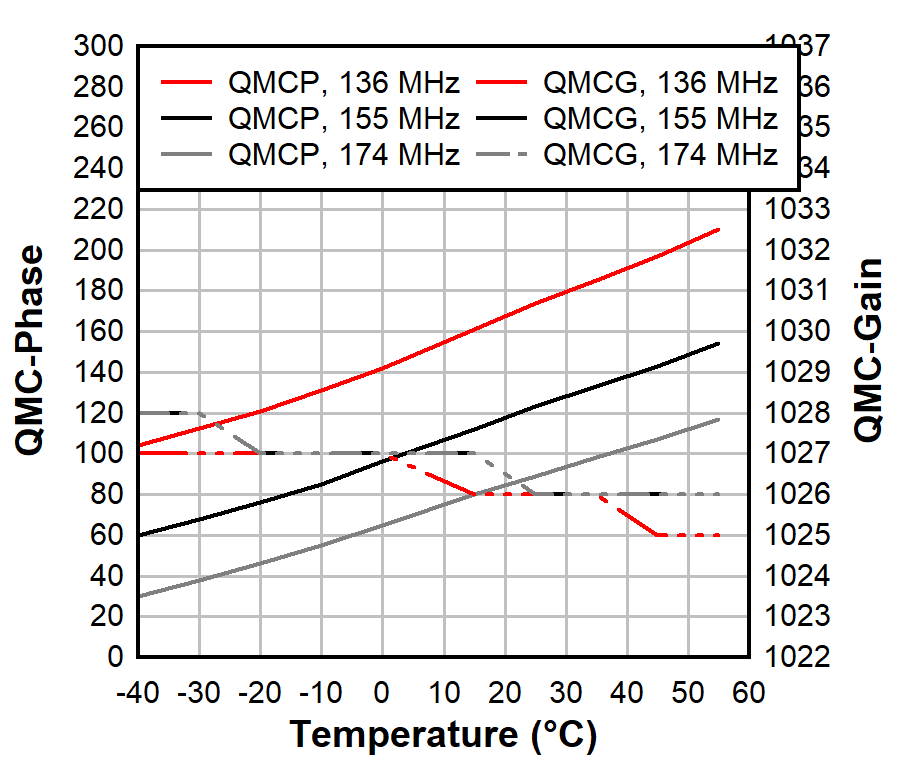
CF and SBS vary over temperature. The optimized QMC correction values shift over temperature. For best performance, the system should monitor board or ambient temperature and apply a temperature compensation adjustment to the QMC parameters to maintain best performance. Figure 2-9 and Figure 2-10 show the temperature slope of the QMC parameters. As before, the QMC-Phase has the most variation. In general, the parameter slope is linear with respect to temperature. Table 2-1 lists the temperature slopes across the frequency range.
 Figure 2-9 DC Offset I/Q vs Temperature
 Figure 2-10 QMC vs Temperature
Table 2-1 Temperature Slope vs Frequency
| Temperature Slope Parameter | 136 MHz | 155 MHz | 174 MHz |
|---|---|---|---|
| mT_DCI | –0.11 | –0.09 | –0.10 |
mT_DCQ | 0.07 | 0.06 | 0.06 |
mT_Gain | –0.04 | –0.06 | –0.08 |
mT_Phase | 1.90 | 1.62 | 1.41 |