SLVAEX3 October 2020 TPS8802 , TPS8804
4.1 Measurement Procedure
The SNR of eight different configurations using three digital filtering methods is measured to identify optimal SNR techniques and verify the trends in the calculations. For each measurement, the RPH gain resistors are 1.5 MΩ, gain stage amplification is 32.25, AMUX buffer capacitor is 1 nF, and the CPH compensation capacitor and AMUX buffer resistor are varied to achieve the τ1 and τ2 in Table 4-1. A photoelectric smoke sensor from a commonly available smoke alarm is attached to a TPS8802EVM and sealed to prevent dust from affecting the signal level. The photodiode signal is generated from internal reflections in the chamber. The photodiode current is estimated to be 2.7 nA. All tests use a 3.0 V VBAT supply and 100 mA LED current, and the photodiode capacitance is measured to be 51 pF.
The noise is measured under two system conditions. The ideal system is powered with a 3.0 V supply connected to VBAT, has the photo amplifier continuously enabled and a signal generator connected to LEDEN to enable the LED. The real system uses a MSP430F5529 Launchpad to enable the photo amplifier, LED, and boost converter to replicate the conditions of a real smoke alarm with a 2.0 V supply voltage on VBAT. The boost converter is briefly enabled before enabling the LED to charge the LED supply and VCC capacitors.
The buffered AMUX voltage is probed with an oscilloscope to capture 100 kilosamples at 100 megasamples per second. 100 waveforms of each condition are captured. The samples are centered on the LED_EN rising edge, and the LED_EN pulse is extended by 15 μs to accommodate for the TPS880x LED driver propagation delay. This captures 500 μs of the signal before the LED is enabled and 500 μs after the LED is enabled. The samples are imported into MATLAB, where they are processed to simulate a microcontroller’s ADC.
| # | tLED (μs) | τ1 (μs) | τ2 (μs) | System |
|---|---|---|---|---|
| 1 | 50 | 15 | 15 | Ideal |
| 2 | 100 | 15 | 15 | Ideal |
| 3 | 100 | 33 | 15 | Ideal |
| 4 | 100 | 33 | 30 | Ideal |
| 5 | 100 | 33 | 30 | Real |
| 6 | 100 | 59 | 30 | Ideal |
| 7 | 100 | 59 | 60 | Ideal |
| 8 | 200 | 59 | 60 | Ideal |
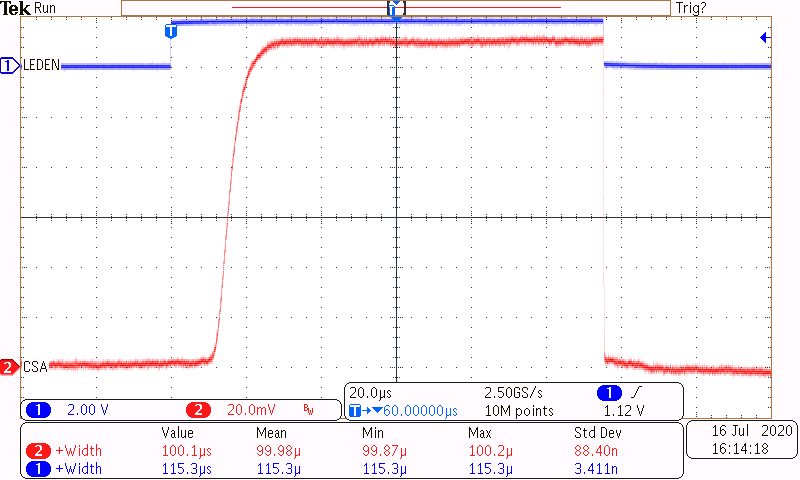 Figure 4-1 LEDEN and CSA Voltage (LED
Current) for a 100 µs LED Pulse
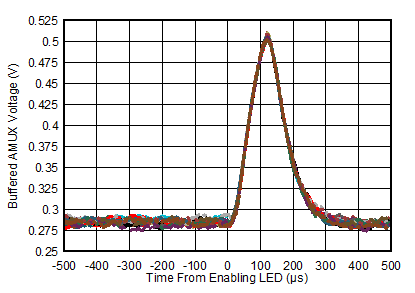 Figure 4-3 20 of 100 Waveform
Captures of Configuration 4
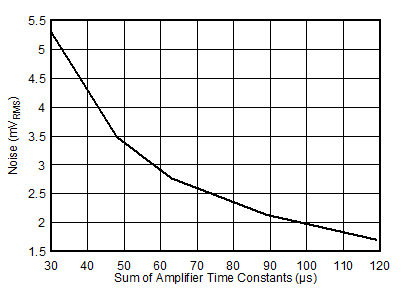 Figure 4-5 Measured Noise Level of
Each Time Constant
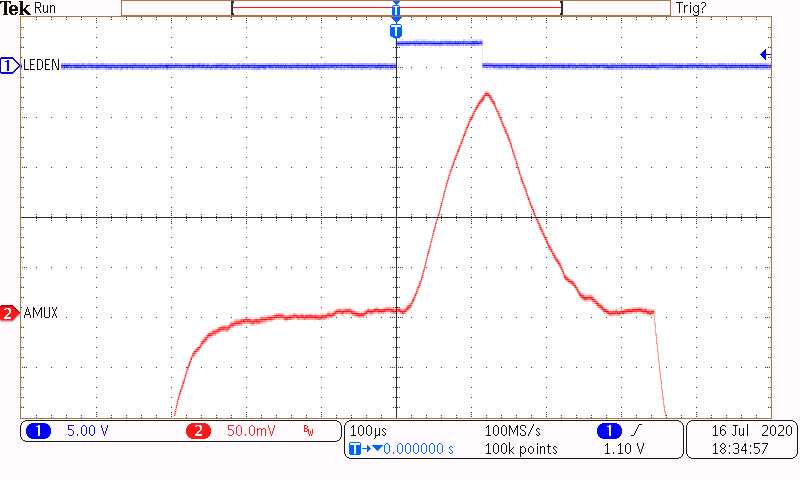 Figure 4-2 Buffered AMUX Pulse With
Real Alarm Conditions
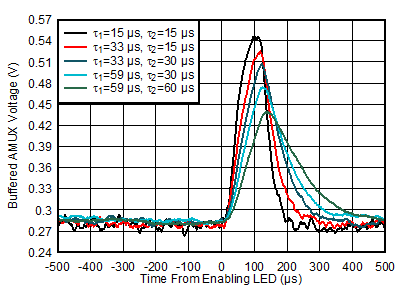 Figure 4-4 Single Waveform Captures
of Each Time Constant