SNIU050 October 2022 LM60
4.2 Data Capture Tab
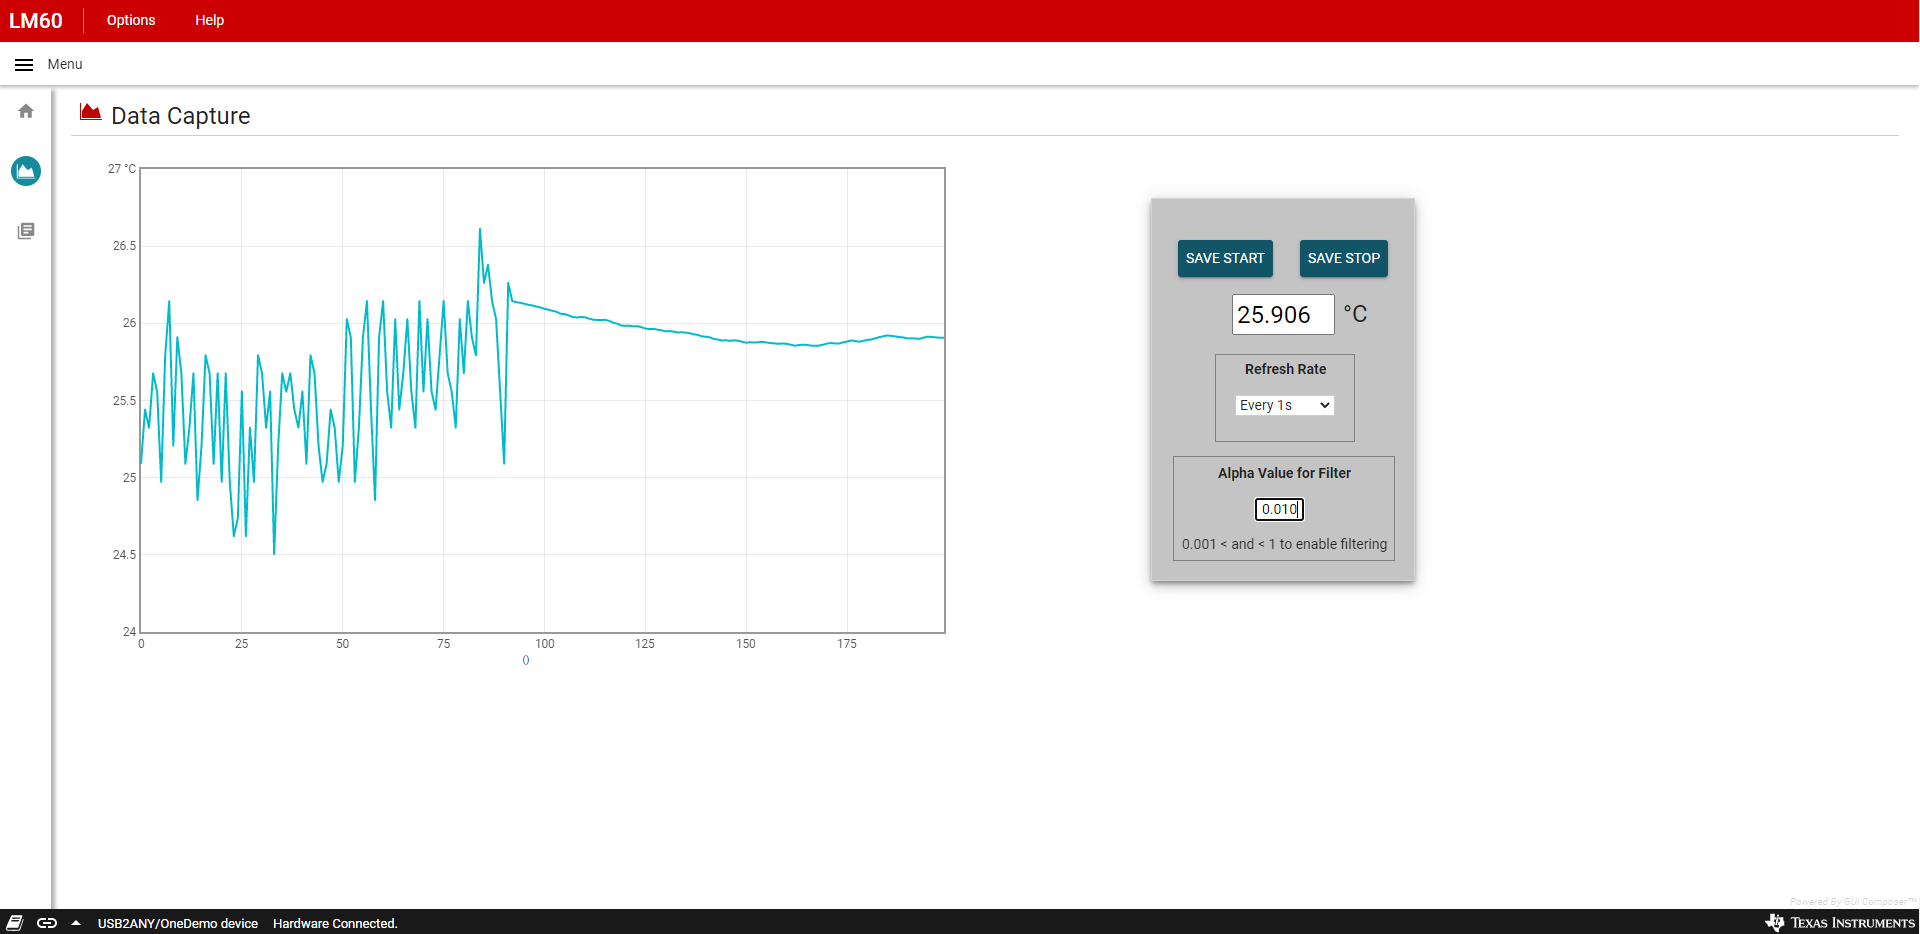
The Save Start and Save Stop buttons on the Data Capture tab allow the user to begin recording the temperature data in a .csv file. Press the Save Start button to start the download and press Save Stop to stop the download.
The Data Capture tab will automatically begin collecting temperature data when the application is launched. The data is displayed in a scalar graph and will default to a refresh rate of 1 second. The drop-down menu allows the user to change the refresh rate for the graph and temperature display. The options are the following:
- Off
- As Fast As Possible
- Every 500 ms
- Every 1 s
- Every 5 s
- Every 10 s
- Every 60 s
Additionally, the LM60EVM comes equipped with a firmware-based, low-pass filter to remove noise that can cause erroneous temperature measurements. This method eliminates the need for implementing an extra resistor and capacitor. The alpha value controls how much noise is filtered out. An alpha value of 1 (default) will behave like no filter is being used. On the other hand, an alpha value of 0.1 eliminates a lot of noise. Try inputting different alpha values between 0.001 and 1 to see how the filter response changes in real time.
 Figure 4-2 Data Capture Without Filter
 Figure 4-3 Data Capture After Filter Implemented