SNLA446 November 2024 DS320PR410
6 Eye Height Page
The Eye Height Page can assist the user in observing the effects of the redriver EQ settings in their system. The page can be used to display the EyeScan plot of the signal passing through the redriver for each active channel of the connected devices. Further information regarding EyeScan can be found in the Eye Scan with TI PCI-Express Gen5.0 Redrivers, application note. TI recommends the use other lane margining tools to monitor signal quality at each end of the PCIe link to determine best system performance. This tool can be used as a reference and cannot provide best system performance based on EyeScan results alone.
- Select the desired Scale Per Step
as shown in Figure 6-1 for the EyeScan capture. This parameter determines the captured
voltage range of the EyeScan operation, providing four options for added
granularity if desired. By default, this parameter is set to ±400mV (12.5mV Step).
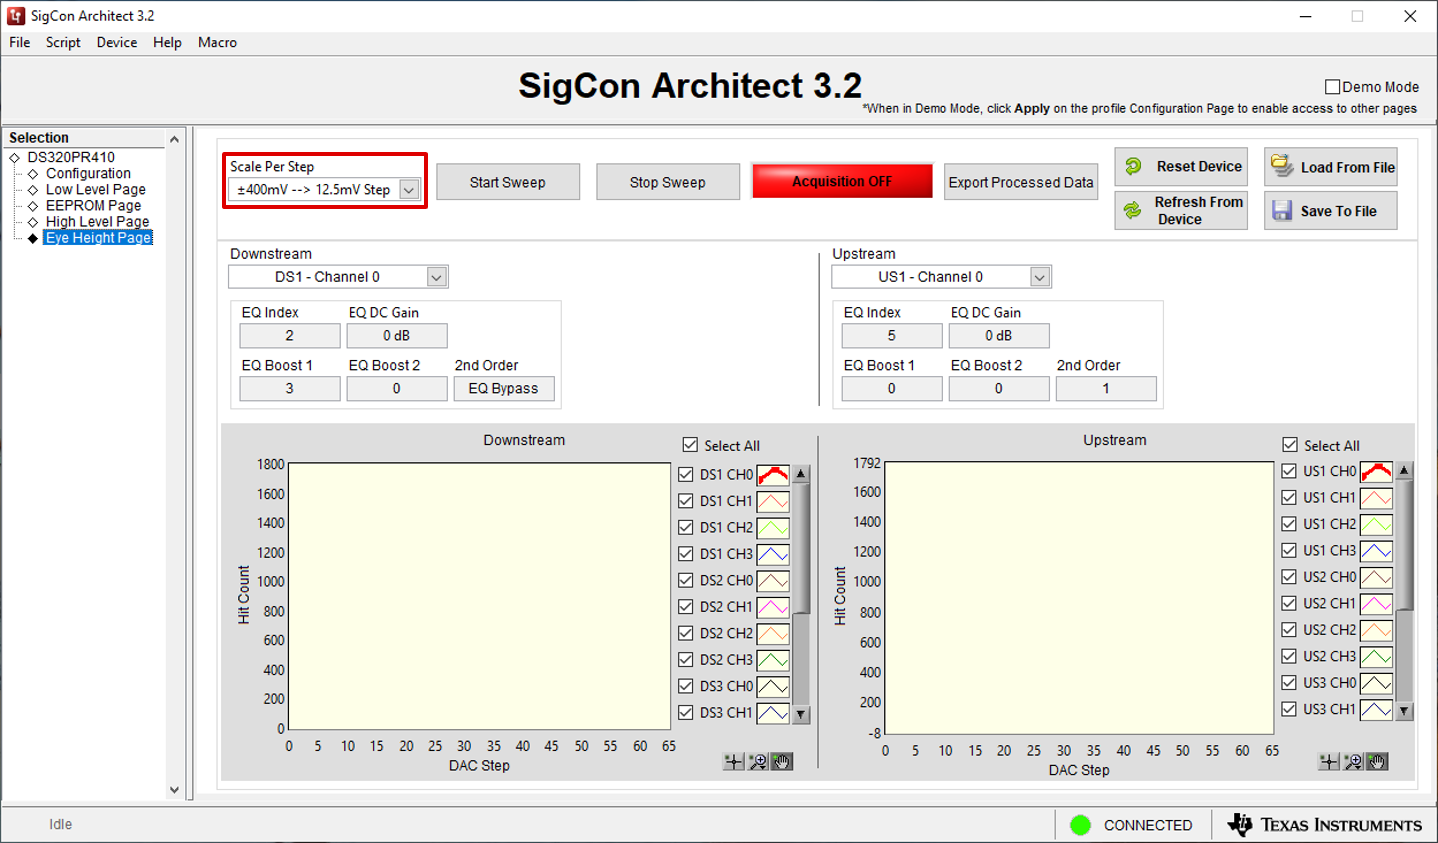
Figure 6-1 Eye Height Page: Scale Per Step - Select the channels for the desired EyeScan capture
using the DSx/USx CHx check boxes or the Select All check boxes for each
Downstream and Upstream device. These options are highlighted in Figure 6-2.
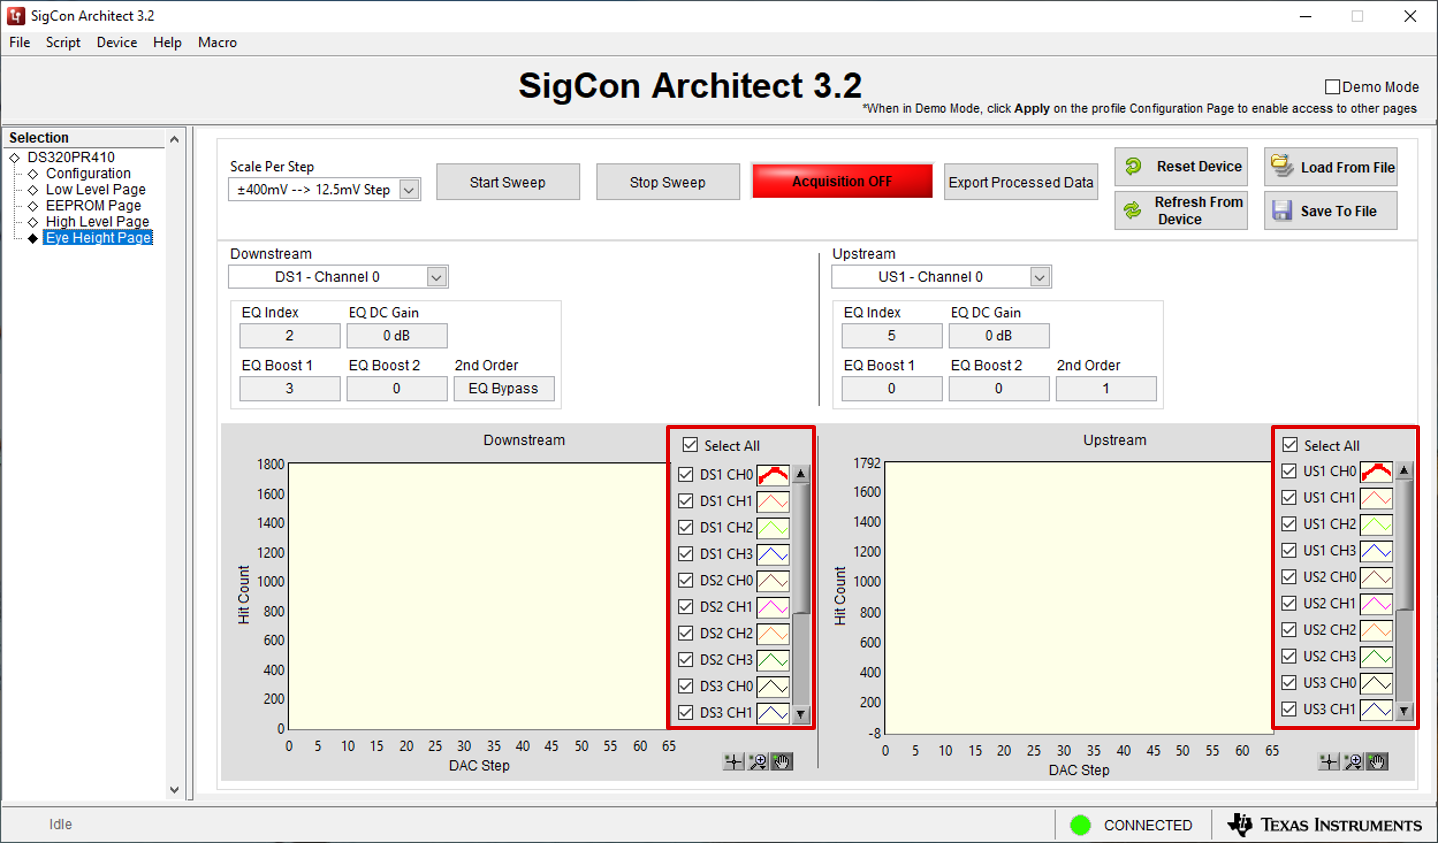
Figure 6-2 Eye Height Page: Select EyeScan Channels - Click the Start Sweep button to
begin the EyeScan plot capture. The redriver automatically captures the
EyeScan for each selected channel using the programmed redriver EQ settings and
displays the result in the Downstream and Upstream plots. The scanning
status can be found in the red and green status indicator box on the page, shown in Figure 6-4. Click
the Stop Sweep button to cancel the current EyeScan sweep. Please note that
clicking the Stop Sweep button ends the capture and plots all channel
EyeScan results captured up to the point of cancellation. These buttons are
highlighted in Figure 6-3.
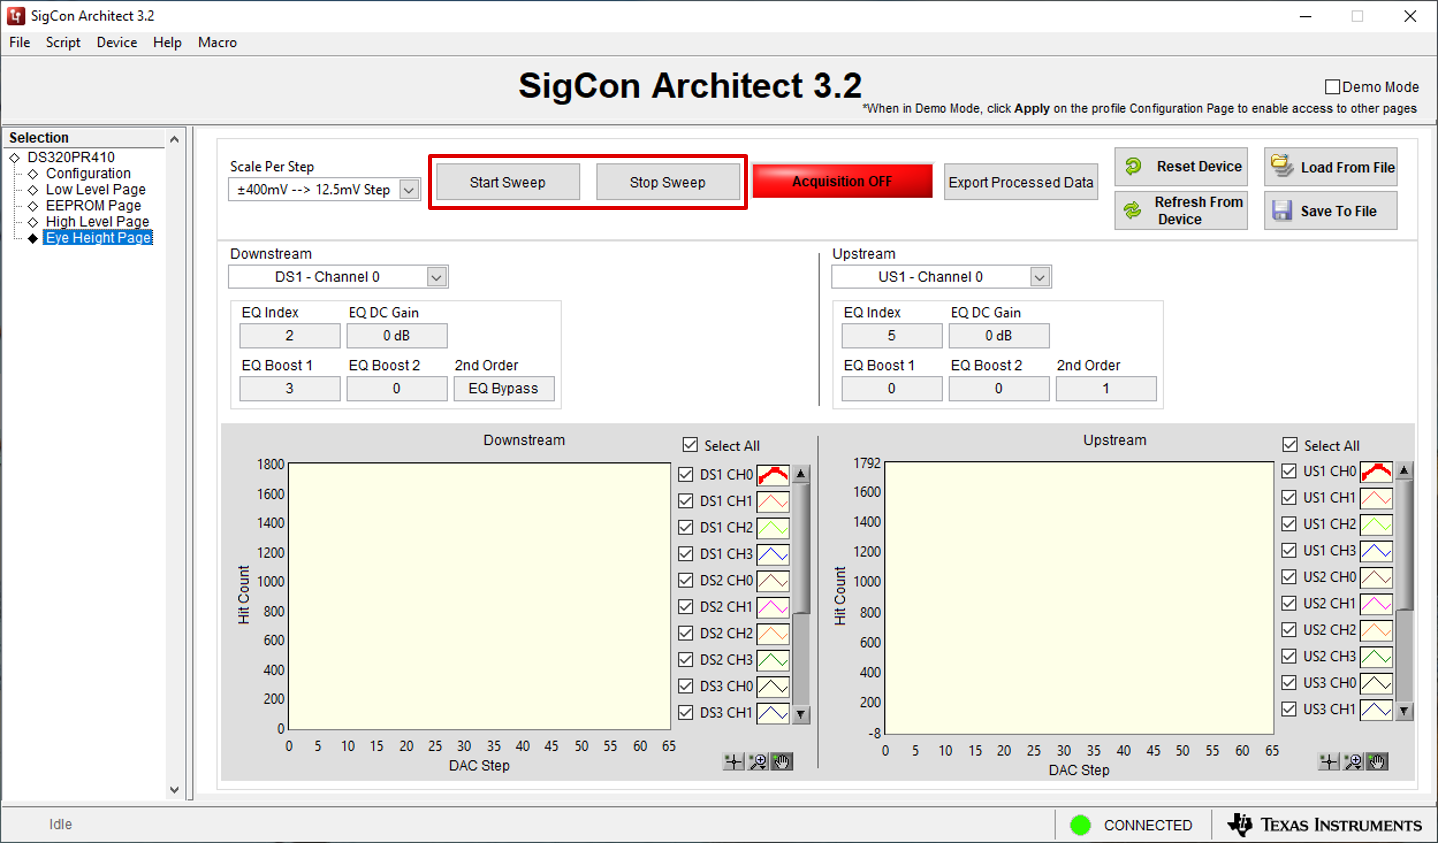
Figure 6-3 Eye Height Page: Start Sweep and Stop Sweep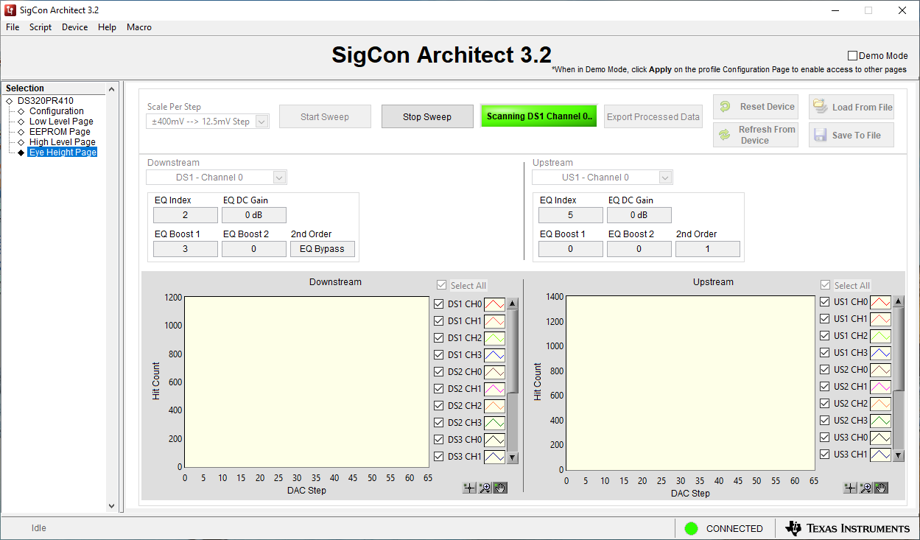
Figure 6-4 Eye Height Page: EyeScan Sweep in Progress - After completion of the sweep, the plots
display the EyeScan sweep results. An example result plot is shown in Figure 6-5. The
Downstream and Upstream plot channel selectors highlighted in Figure 6-6 can be
used to emphasize a desired channel on each plot and view the channel's EQ settings. Note
that this plot displays the hit counts at varying voltage levels for the selected channels
captured directly at the transmitter output pins of the redriver. TI recommends the use
other lane margining tools to monitor signal quality at each end of the PCIe link. This
tool can be used as a reference and cannot provide best system performance based on this
plot alone.
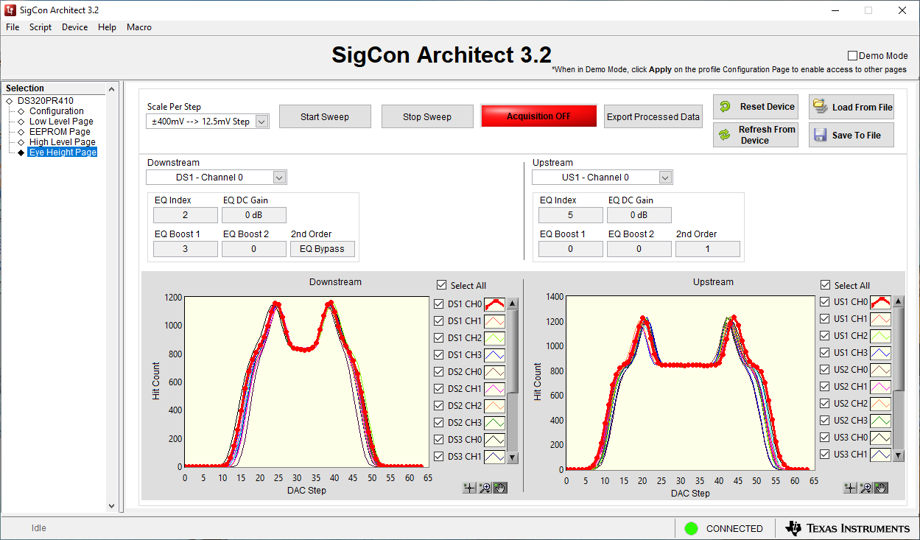
Figure 6-5 Eye Height Page: EyeScan Results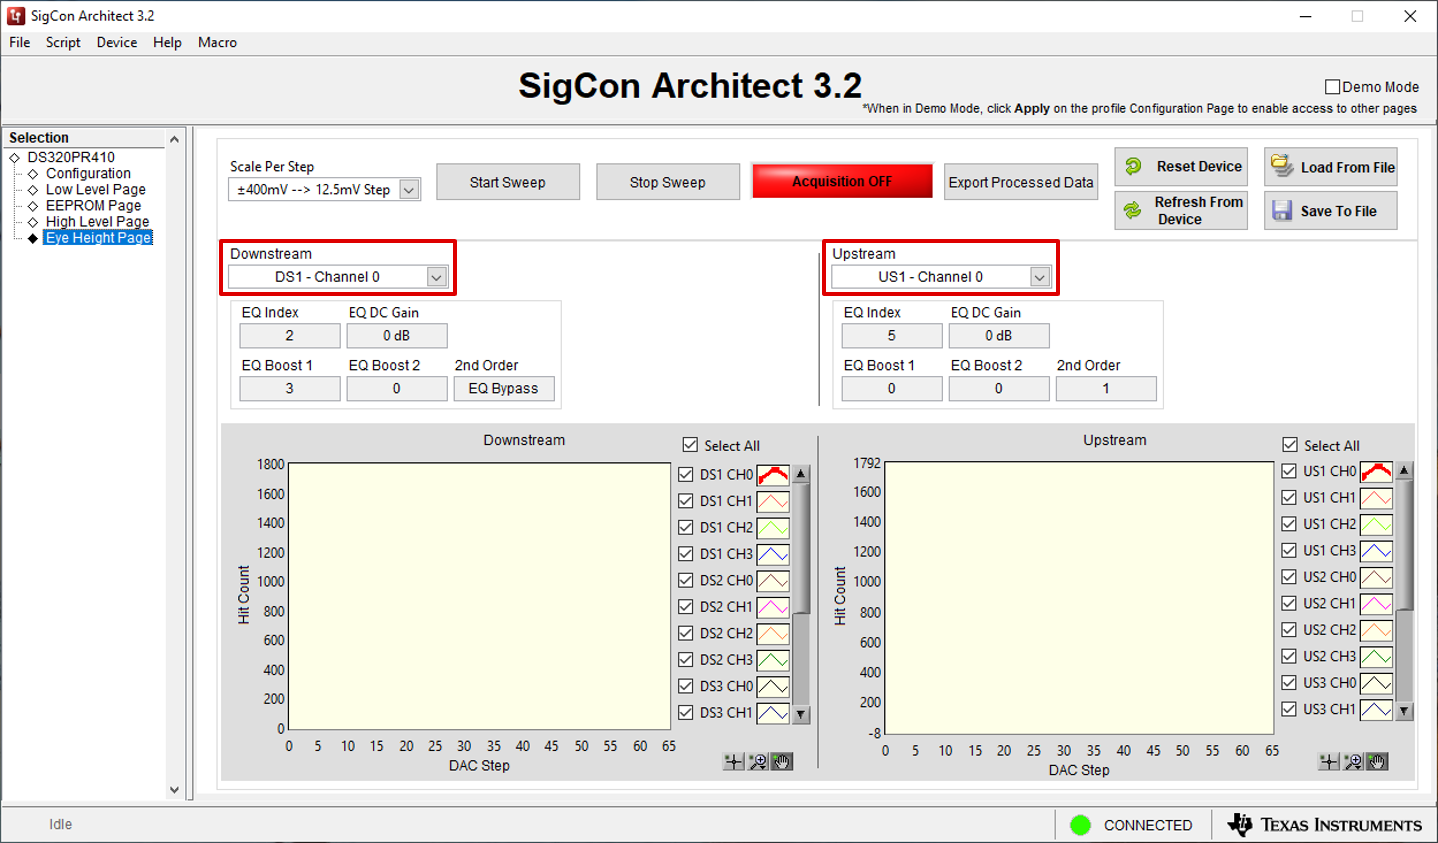
Figure 6-6 Eye Height Page: Plot Channel Selectors - To export the selected channel's raw
EyeScan data, click the Export Processed Data button highlighted in Figure 6-7. Save
the raw data file using the prompted File Explorer.
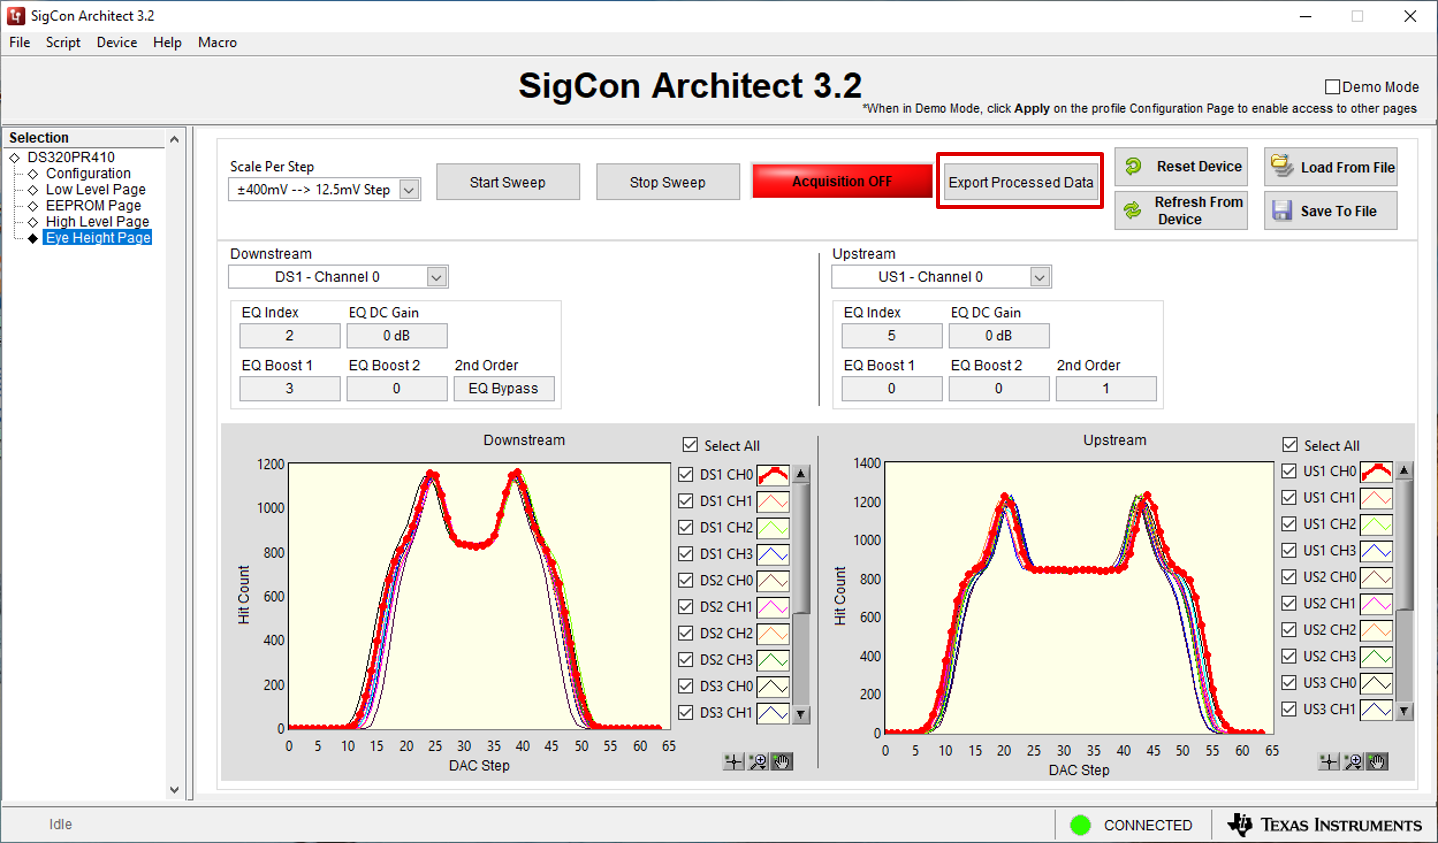
Figure 6-7 Eye Height Page: Export Processed Data - Additionally,
the plots can be customized by clicking the plot icon next to each channel. An example
customization menu is shown in Figure 6-8.
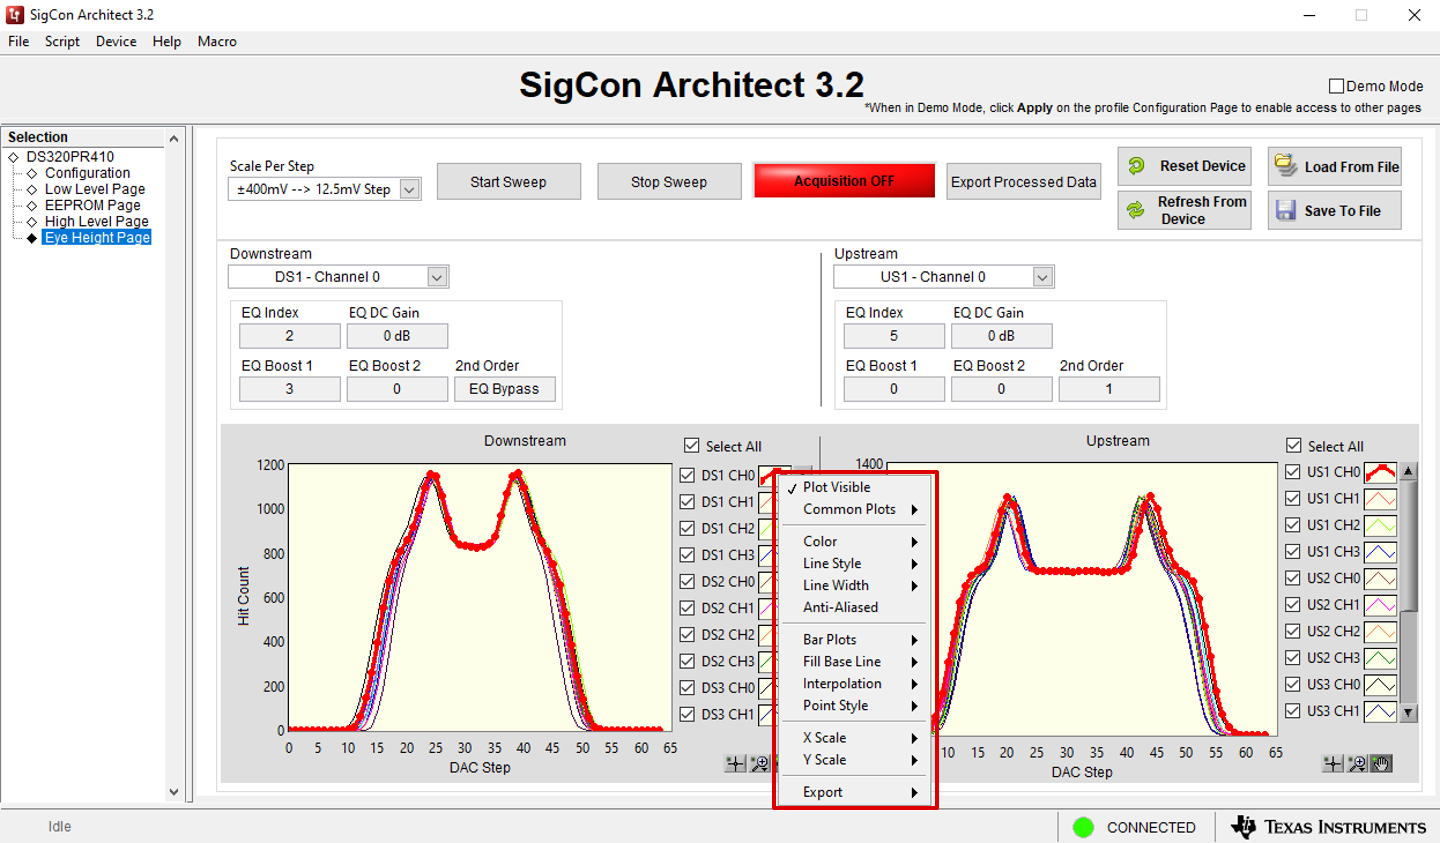
Figure 6-8 Eye Height Page: Customize Plot