SSZTC80 september 2015 TPS53661
Loop gain is an important parameter for characterizing a switch-mode power supply. Using a frequency analyzer to measure loop gain gives you a way to stabilize the power supply and optimize transient response.
Before measuring the Bode plot, you need to first break the loop and insert a small resistor at the breaking point, as shown in Figure 1. The frequency analyzer has a source that injects an AC disturbance, ṽds, across this small resistor.
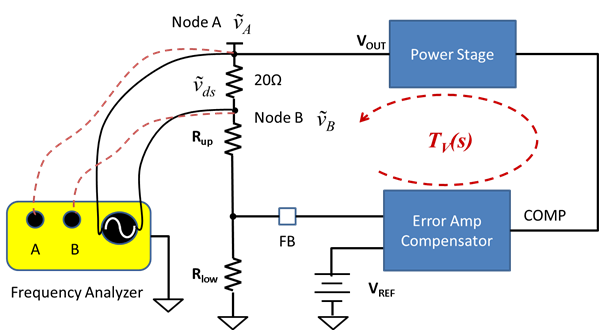 Figure 1 Typical Bode Plot Measurement
Setup
Figure 1 Typical Bode Plot Measurement
SetupAs a result, AC fluctuation occurs at the two nodes, A and B, across the breaking point. The frequency analyzer has two receivers to measure signals at nodes A and B, ṽA and ṽB. You can calculate the system loop gain, TV, with Equation 1:

To measure TV accurately, the analyzer must measure ṽA and ṽB accurately. A frequency analyzer receiver has limited signal measurement resolution. In this post, I will use the AP300 from AP Instruments, a widely used frequency response analyzer, as a setup example. Figure 2 shows the AP300’s receiver specifications and Figure 3 shows the source specifications.
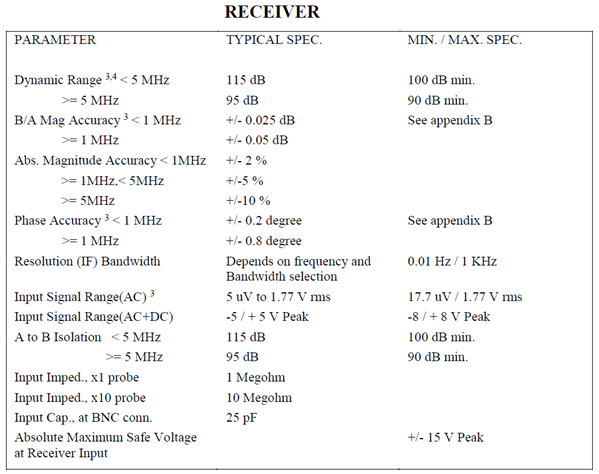 Figure 2 AP300 Frequency Response Analyzer Receiver
Specifications
Figure 2 AP300 Frequency Response Analyzer Receiver
SpecificationsImage Source: AP Instruments
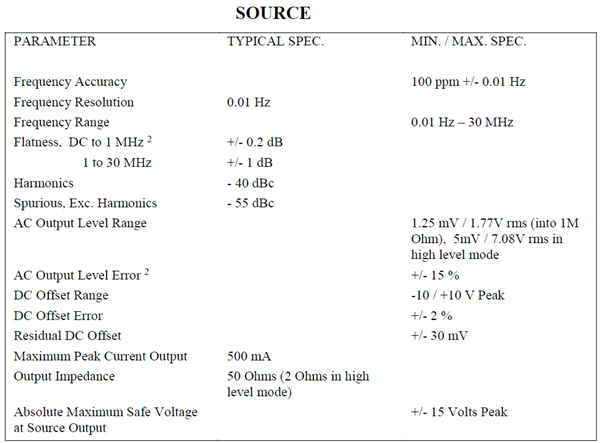 Figure 3 AP300 Frequency Response Analyzer Source
Specifications
Figure 3 AP300 Frequency Response Analyzer Source
SpecificationsImage Source: AP Instruments
Disturbance Injection Signal Amplitude
According to the receiver specs, the measurable signal should be greater than 5µV. To measure voltages, ṽA and ṽB, accurately, the two signals should be of amplitude greater than that measurable by the frequency response analyzer.
Voltages ṽA and ṽB are related to both the disturbance injection signal and the loop gain itself (Equation 2):

Solving Equation 1 and Equation 2 results in Equation 3 and Equation 4:


At frequencies lower than the crossover, the magnitude of loop gain, |TV|, is much greater than 1. Signal ṽB is approximated by ṽds/|TV|. To guarantee that signal ṽB is greater than the measurable amplitude of 5µV, the disturbance signal ṽds should be greater than 5µV × |TV|. A power converter with tight regulation usually has DC gain greater than 60dB. As a rule of thumb, ṽds starts from 50mV at 100Hz.
Another important specification is the output impedance of the source. The AP300 has 50Ω output impedance. To ensure the delivery of sufficient energy, it’s best to insert a 50Ω matching resistor at the breaking point. Using a smaller resistor is acceptable if you adjust the injection signal amplitude to compensate for the loss of signal strength, but don’t choose too small a resistor. I recommend using a resistor of value greater than one-fifth the output impedance of the frequency response analyzer source output port.
If you inserted a small resistor, use Equation 5 to adjust the disturbance signal amplitude. For example, for a 20Ω resistor, ṽds should start from 88mV at 100Hz.

It is not a good idea to keep large constant disturbance signal amplitude over the whole frequency range. As frequency increases, the magnitude of |TV| decreases, which then makes signal ṽB increase. For some applications, a large disturbance at crossover might saturate the error amplifier or the duty cycle. To keep the signal as small as possible, the disturbance signal should decrease with frequency.
Figure 4 shows the AP300 interface, which provides a programmable source. The green trace in the graph shows the disturbance signal amplitude over frequency.
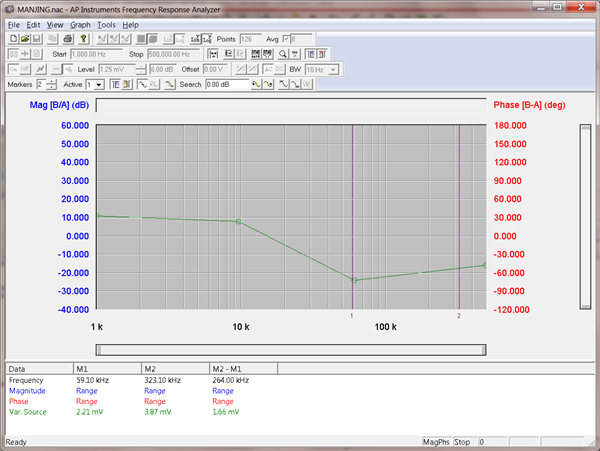 Figure 4 The AP300 Bode Plot Graphical User Interface,
GUI
Figure 4 The AP300 Bode Plot Graphical User Interface,
GUIFigure 5 shows a Bode plot measured with a constant disturbance signal of 25mV. The measured Bode plot shows a gain of only 50dB at 100Hz, while I estimated over 70dB gain at 100Hz from the high-performance controller, TPS53661. DC gain is an important indicator for regulator output DC regulation.
 Figure 5 Bode Plot of a Step-down
Converter with the TPS53661 Controller, with a Constant Disturbance Signal of
25mV
Figure 5 Bode Plot of a Step-down
Converter with the TPS53661 Controller, with a Constant Disturbance Signal of
25mVI adjusted the disturbance signal accordingly and measured the Bode plot again. The measured Bode plot shows a much higher gain at 100Hz, as shown in Figure 6.
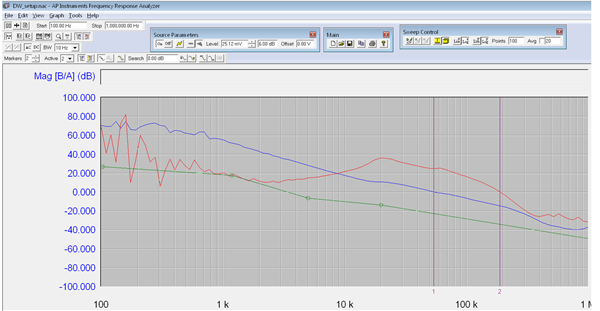 Figure 6 Bode Plot of a Step-down
Converter with the TPS53661 Controller, with a Programmable Disturbance
Signal
Figure 6 Bode Plot of a Step-down
Converter with the TPS53661 Controller, with a Programmable Disturbance
SignalMeasurement IF-bandwidth Selection
The intermediate frequency, IF-bandwidth, reducing the IF receiver bandwidth reduce the effect of random noise on the measurement. It takes the frequency analyzer longer to complete the measurement.
Figure 6 shows the difference between measurements with different signal bandwidths. The Bode plot measured with a 10Hz bandwidth is clean and smooth. The Bode plot measured with a 100Hz bandwidth shows a lot of glitches for frequencies lower than 1 KHz. For applications with crossover below 10 KHz, I recommend use IF bandwidth less than 10Hz for a clean bode plot.
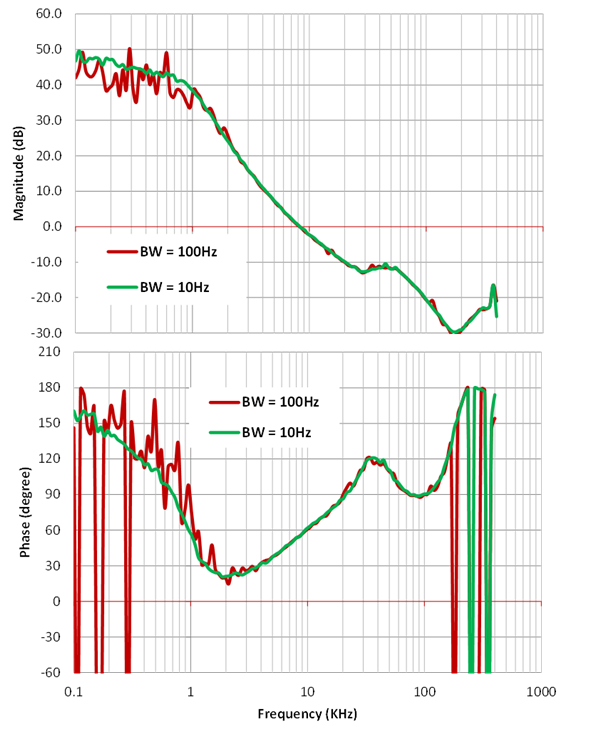 Figure 7 Bode Plots with Different
Measurement Bandwidths
Figure 7 Bode Plots with Different
Measurement BandwidthsSetting disturbance signal at the correct amplitude is important for accurate Bode plot measurement. This post provides equations for engineer to estimate the proper disturbance signal amplitude. For applications with low crossover, the IF bandwidth should be small accordingly to provide a clean bode plot and accurate phase margin.
Additional Resources
- Read the application note, “How to Measure the Loop Transfer Function of Power Supplies”
- Read the AP300 frequency response analyzer manual
- Read more Power Tips blogs