SLAAEH6 September 2024 TAA5212 , TAA5412-Q1 , TAC5111 , TAC5111-Q1 , TAC5112 , TAC5211 , TAC5212 , TAC5212-Q1 , TAC5311-Q1 , TAC5312-Q1 , TAC5411-Q1 , TAC5412-Q1 , TAD5112 , TAD5112-Q1 , TAD5212 , TAD5212-Q1
- 1
- Abstract
- Trademarks
- 1Introduction
- 2Infinite Impulse Response Filters
-
3TAC5x1x and TAC5x1x-Q1 Digital Biquad
Filters
- 3.1 Filter Design using PurePath™ Console
- 3.2 Generating Coefficients N0, N1, N2, D1, D2 using a Digital Filter Design Package
- 3.3 Avoiding Overflow Conditions
- 3.4 Biquad Filter Allocation on Recording Channel
- 3.5 Biquad Filter Allocation on Playback Channel
- 3.6 Biquad Filter Programming Example on the TAC5x1x
- 4Typical Audio Applications of Biquad Filters
- 5Summary
- 6References
3.1.1 Example of Programming Biquad Filters Using PurePath™ Console
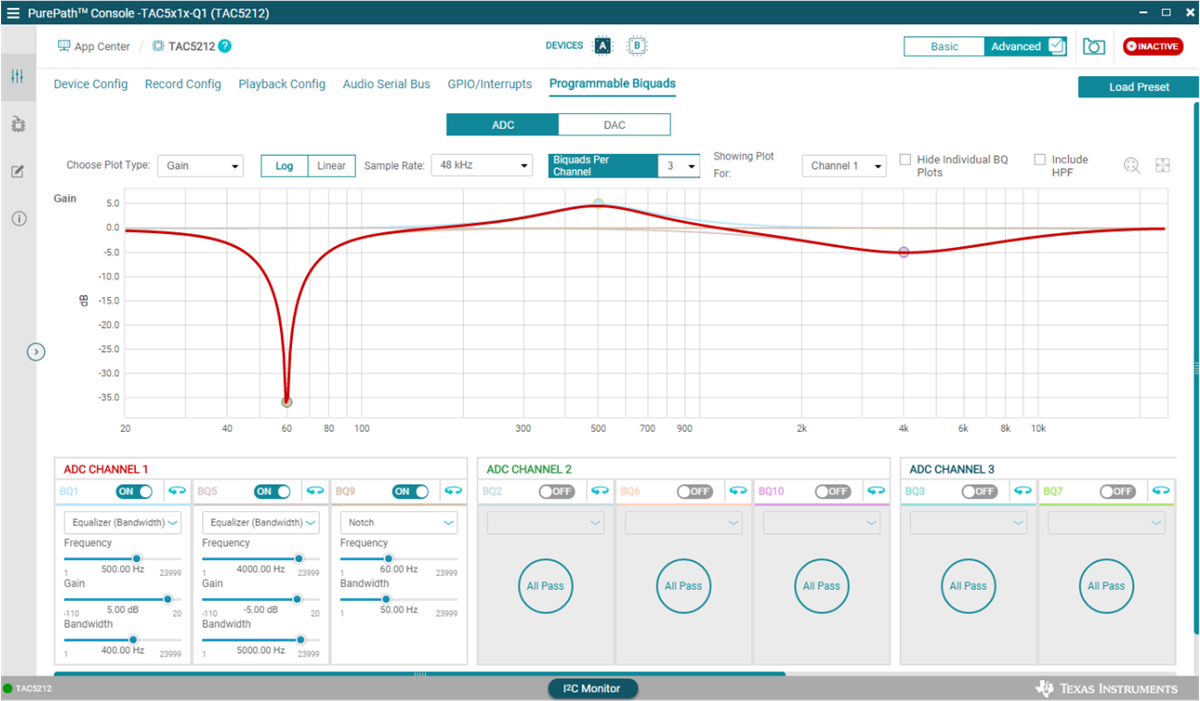
Figure 3-3 shows how to create a set of filters for 5dB boost at 500Hz with bandwidth of 400Hz, cut –5dB at 4kHz with 5kHz bandwidth, and a Notch filter at 60Hz with 50Hz bandwidth for channel 1. The overall response of all three filters is plotted in red. The graphical plots allows users to zoom in and out of the frequency response plot and choose logarithmic or linear frequency axis, plot gain, phase, group delay, or impulse response.

Figure 3-3 PurePath™ Console Programmable Biquad Filter Example
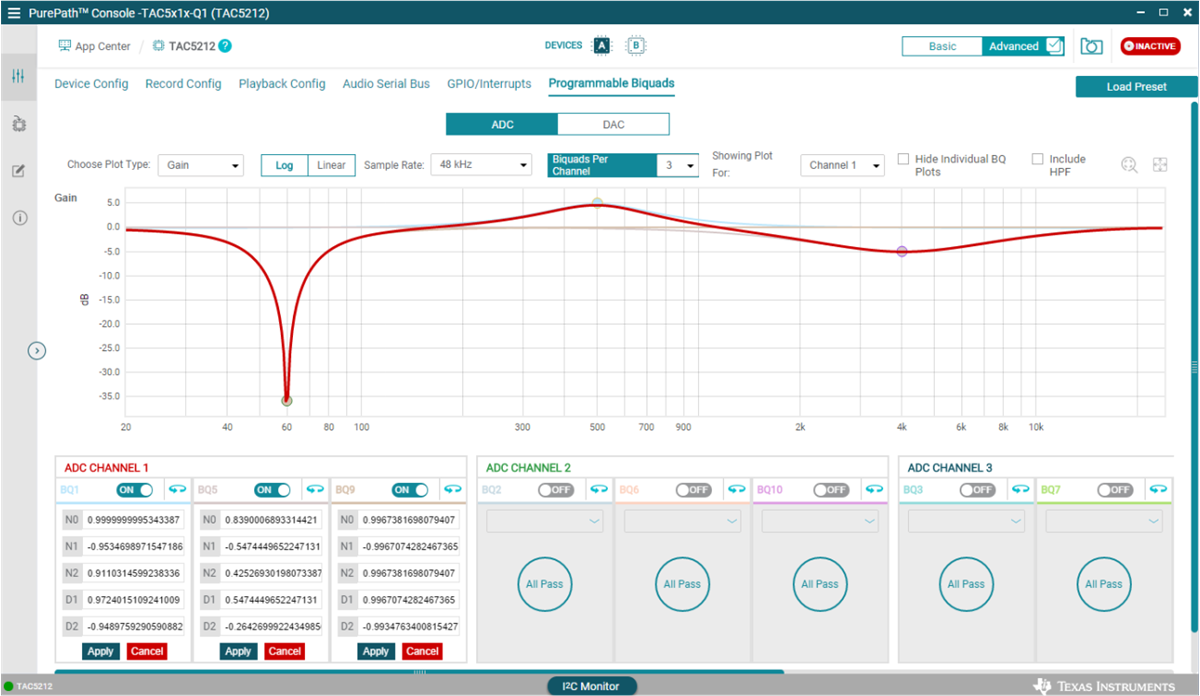
Clicking on the swivel arrow at each biquad shows the normalized floating point coefficients for N0, N1, N2, D1, and D2 of Equation 3 as shown in Figure 3-4. Note the PurePath™ Console has computed the floating point coefficients b0, b1, b2, a1, and a2 of Equation 2 and converted into the necessary values for N0, N1, N2, D1, and D2. Clicking the Apply button transmits the coefficients through I2C to the TAC5x1x/TAC5x1x-Q1 devices on the EVM.

Figure 3-4 PurePath™ Console Programmable Biquad Filter Example Showing the Computed Coefficients in Normalized Floating Point Format