SLAAEO8 October 2024 MSPM0C1103 , MSPM0C1103-Q1 , MSPM0C1104 , MSPM0C1104-Q1 , MSPM0G1105 , MSPM0G1106 , MSPM0G1107 , MSPM0G1505 , MSPM0G1506 , MSPM0G1507 , MSPM0G3105 , MSPM0G3105-Q1 , MSPM0G3106 , MSPM0G3106-Q1 , MSPM0G3107 , MSPM0G3107-Q1 , MSPM0G3505 , MSPM0G3505-Q1 , MSPM0G3506 , MSPM0G3506-Q1 , MSPM0G3507 , MSPM0G3507-Q1 , MSPM0G3519 , MSPM0L1105
4.2.1.2 Software
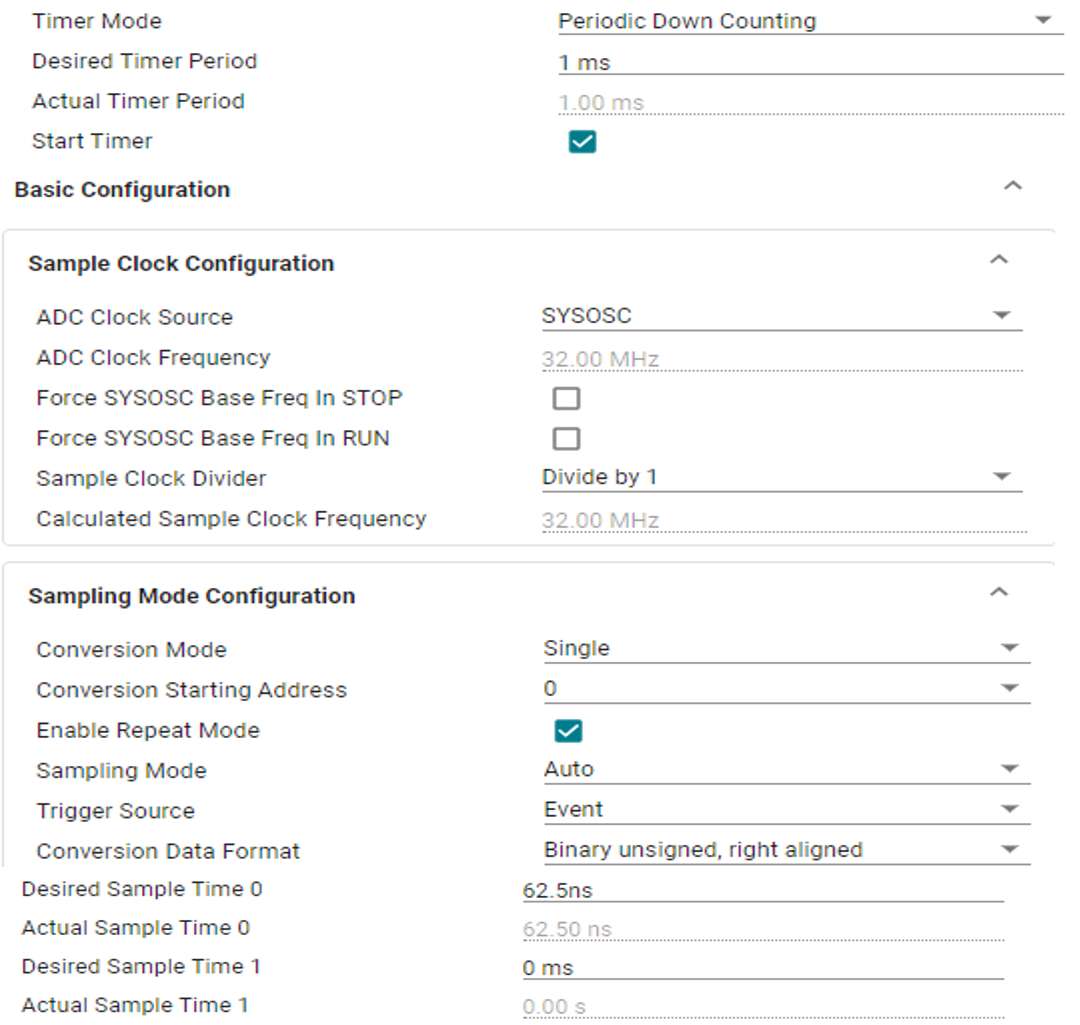
The method of the test is: Tigger ADC sampling and conversion by timer event every 1ms and the ADC result is automatically transported by DMA to an array. The DMA transport size is set to 1024. Every time DMA transport finished, enter DMA interrupt to analyze ADC results and calculate some parameters (average value, peak-peak value, stand deviation, and so on). After that, repeat the progress above for 1000 times, and get the average value or maximum value of each time.
Figure 4-5 shows the basic configuration of ADC in sysconfig. Change reference voltage configuration and oversampling configuration to make comparison of different situation.
 Figure 4-5 ADC DC Test Software Configuration
Here lists the explanation of some parameters that are calculated based on ADC results:
- ttlAveAnalog (V): the average value of analog calculation result based on ADC digital results and the formula below:
- ttlDeltaSample (LSB): the average value of ADC 1024 samples digital results’ peak-peak value;
- ttlMaxDelta (LSB): the maximum value of ADC 1024 samples digital results’ peak-peak value;
- ttlAveSample (LSB): the average value of ADC 1024 samples digital results’ average value;
- ttlStdErr (LSB): the average value of ADC 1024 samples digital results’ standard deviation;
- NoiseStd (V): the average value of ADC 1024 samples digital results’ noise RMS value, which is equal to the samples standard deviation in voltage.
- SNR (1): the average of ADC 1024 samples digital results’ signal-to-noise ration.