SLAK034 December   2024 DAC121S101-SEP


  1.   1
  2.   Abstract
  3.   Trademarks
  4. 1Device Information
    1. 1.1 Device Details
  5. 2Total Dose Test Setup
    1. 2.1 Test Overview
    2. 2.2 Test Description and Facilities
    3. 2.3 Test Setup Details
      1. 2.3.1 Biased
    4. 2.4 Test Configuration and Condition
  6. 3Total Ionizing Dose (RHA) Characterization Test Results
    1. 3.1 Total Ionizing Dose RHA Characterization Summary Results
      1. 3.1.1 VDD Current HDR
      2. 3.1.2 Power Down Current HDR
  7. 4Total Ionizing Dose HDR Report

Power Down Current HDR

Power Down current showed very little variation at 30 krad(Si) but is still within data sheet limits. The graphs below show the min, average, and max data post irradiation for each dose level.
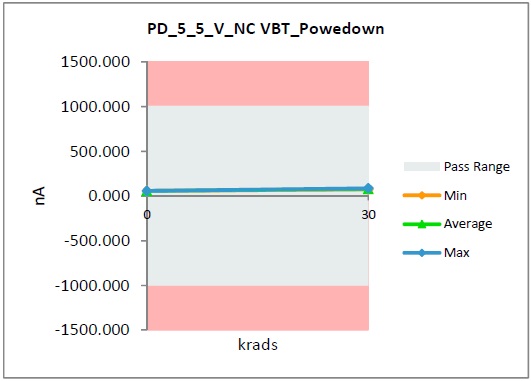
 HDR Radiation Exposure Effect
                    on Power Down Current Figure 3-2 HDR Radiation Exposure Effect on Power Down Current