SLDA058 March 2021 TUSS4470
- Trademarks
- 1Review of Ultrasonic Sensing Range Performance Factors
- 2Methods Overview
- 3Short Range Air-Coupled Test Results
- 4Mid-Range Air-Coupled Test Results
- 5Short Range Water-Coupled Test Results
- 6Resistive Damping Device Comparison
- 7Summary
- 8References
- A Appendix A
- B Appendix B
3.2 TDC1000
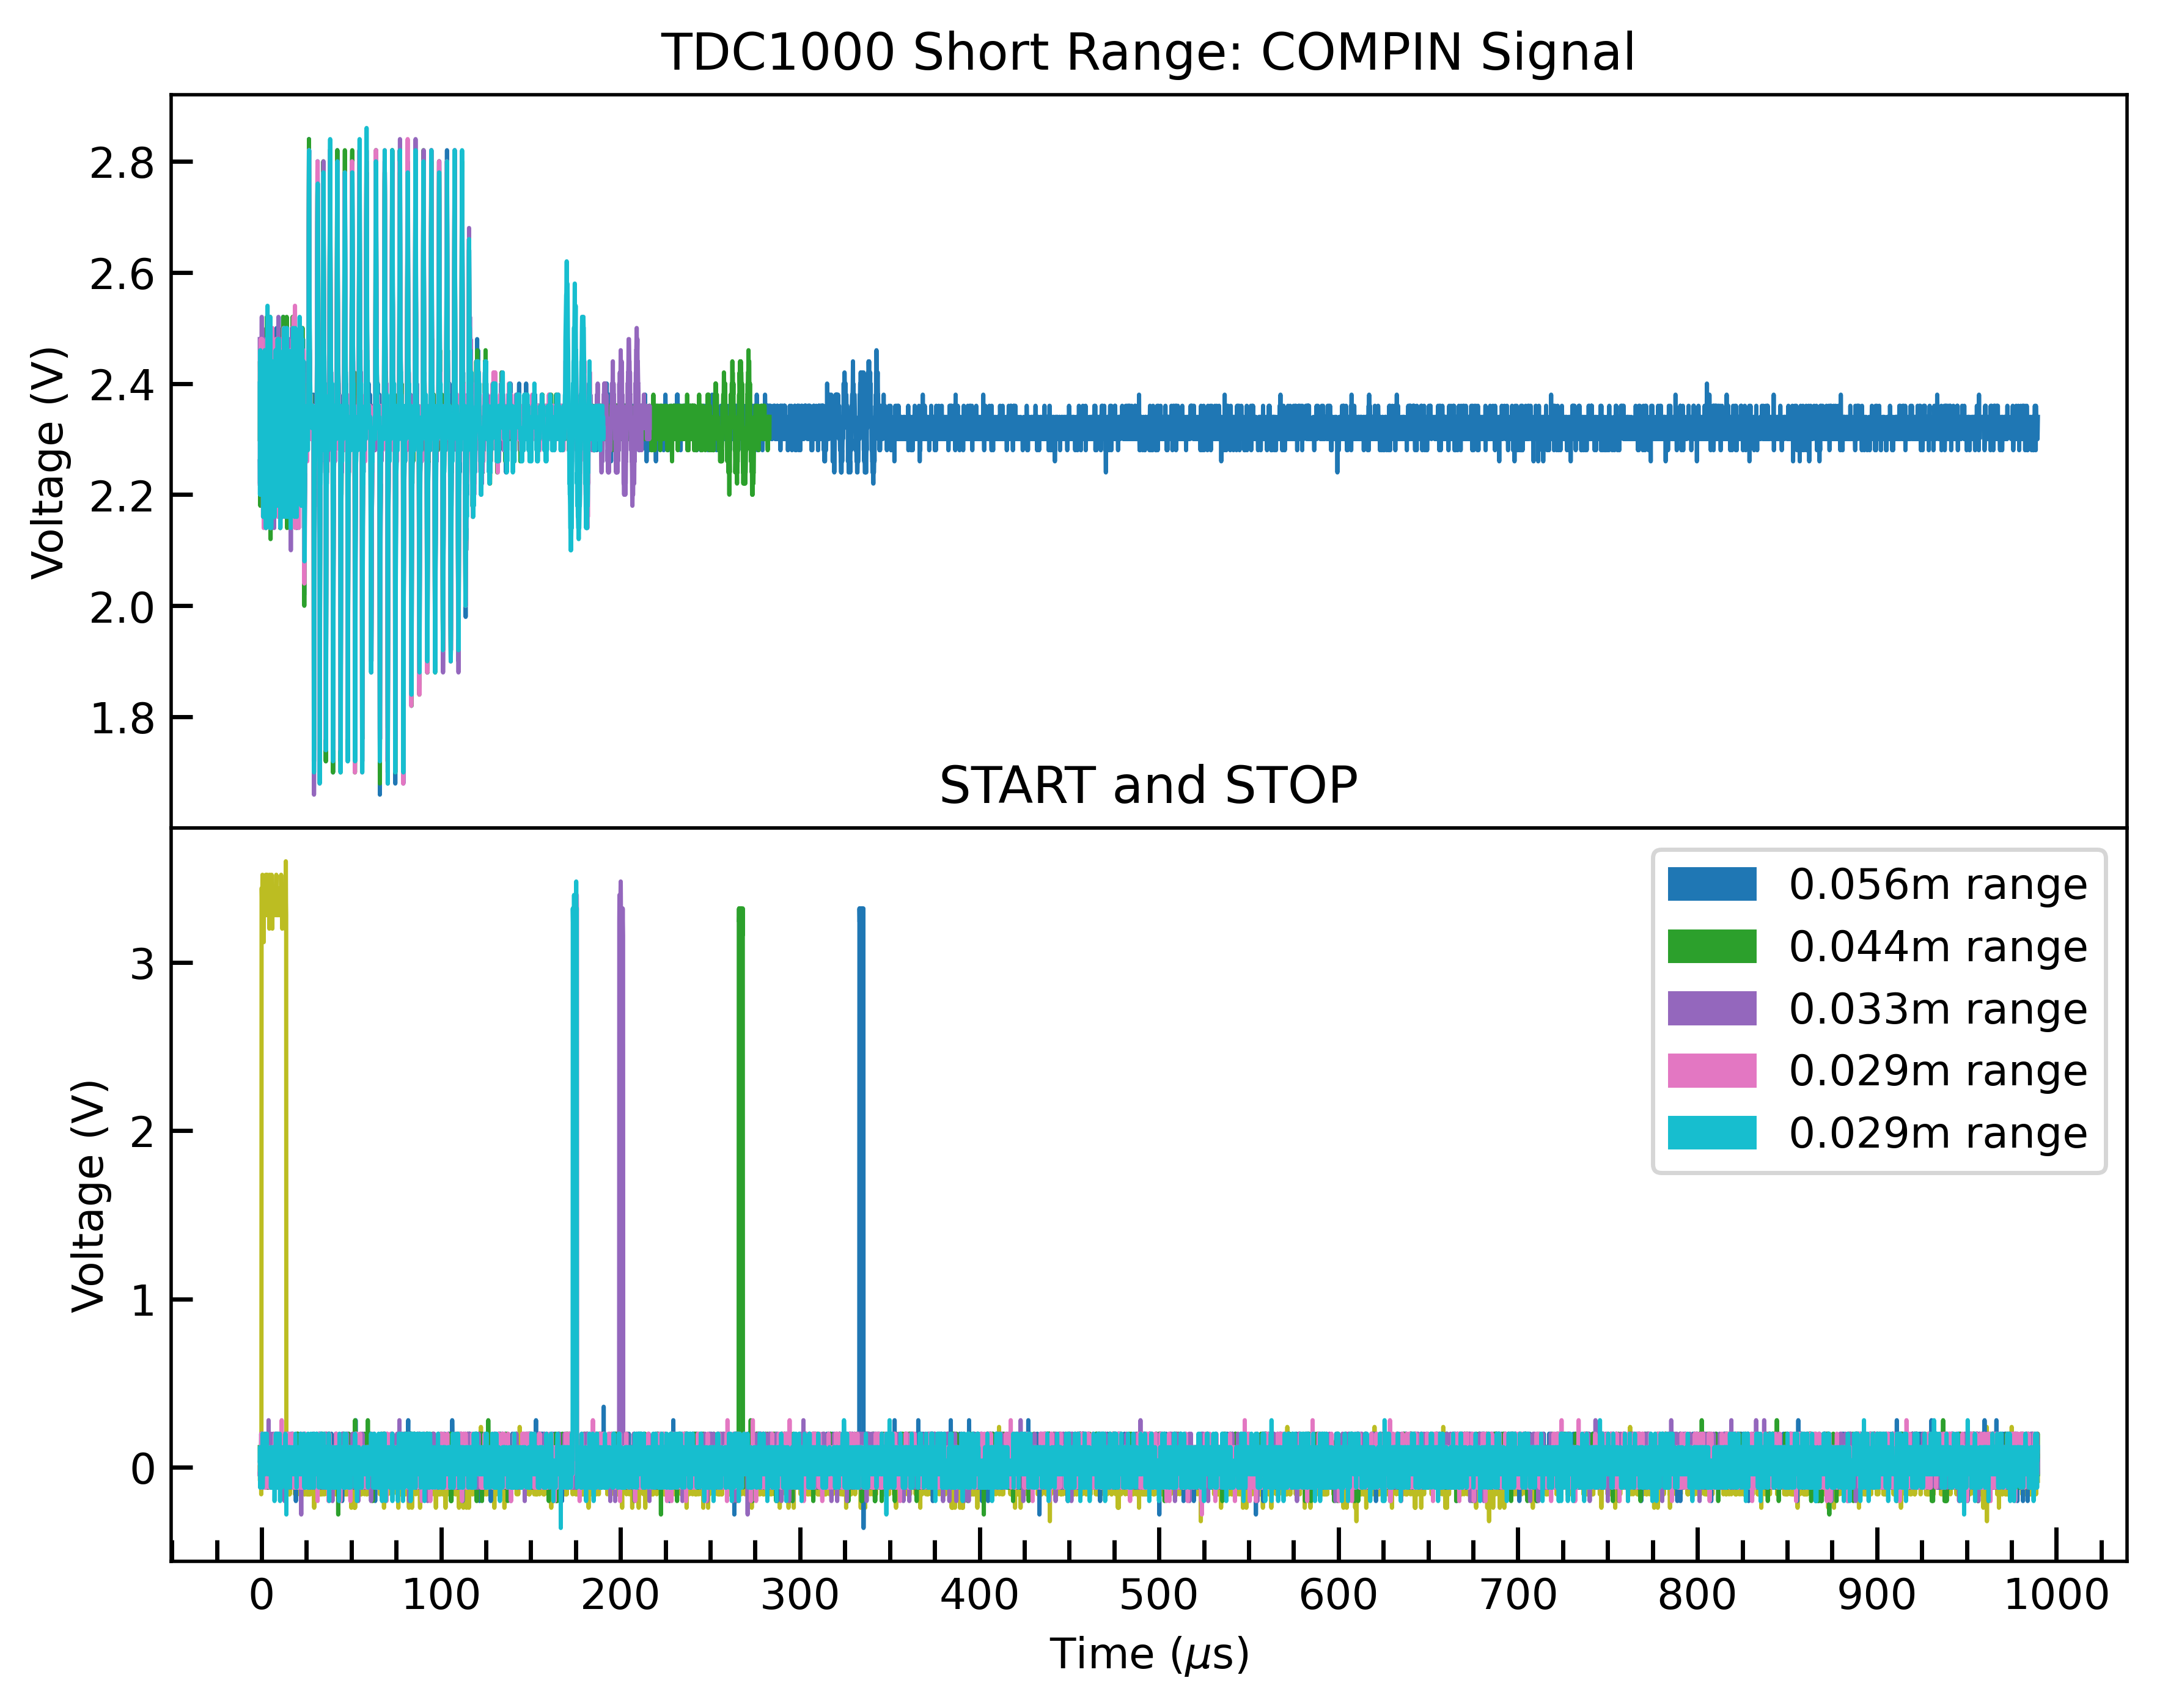
Five measurements were taken, each with decreasing range (increasing water level), represented by separate colors shown in Figure 3-2. The COMPIN signal was probed with an oscilloscope and the data below is overlayed for each measurement. The START and corresponding STOP pulses are shown below the COMPIN plot. STOP pulses are corresponding in time with their respective COMPIN return echo. COMPIN signals are overlayed for visual comparison, and the data is trimmed after the return pulse to avoid visual data overlap. The START pulse is at time t=0 in yellow.
 Figure 3-2 Short Range Air-Coupled Results:
TDC1000
Figure 3-2 Short Range Air-Coupled Results:
TDC1000In the TDC1000 short measurement mode, the minimum range is determined directly by the burst pulse time, blanking time, and TX ringing decay time. The blanking time is set to delay the listen period until just after the transducer ringing falls below ECHO_QUAL_THLD. The above results show that the blanking time was set to delay the listen period until approximately 175 μs, determined such that false STOP pulses triggered by ringing noise would be avoided. Notice that the pink and teal COMPIN signals both are measured at the beginning of the listen period and have a flat leading edge envelope compared to the other data. This happens when the return pulse is partially cut off by the blanking period. A partial echo such as this must be discarded because it does not represent the true ToF. To ensure a true measurement, some margin between the blanking period end and the minimum ToF measurement may be needed. Discarding the last measurement here, the minimum ToF accurately measured with this setup was at a 3.3cm distance from water level to transducer.