SLDA058 March 2021 TUSS4470
- Trademarks
- 1Review of Ultrasonic Sensing Range Performance Factors
- 2Methods Overview
- 3Short Range Air-Coupled Test Results
- 4Mid-Range Air-Coupled Test Results
- 5Short Range Water-Coupled Test Results
- 6Resistive Damping Device Comparison
- 7Summary
- 8References
- A Appendix A
- B Appendix B
3.1 TUSS4470
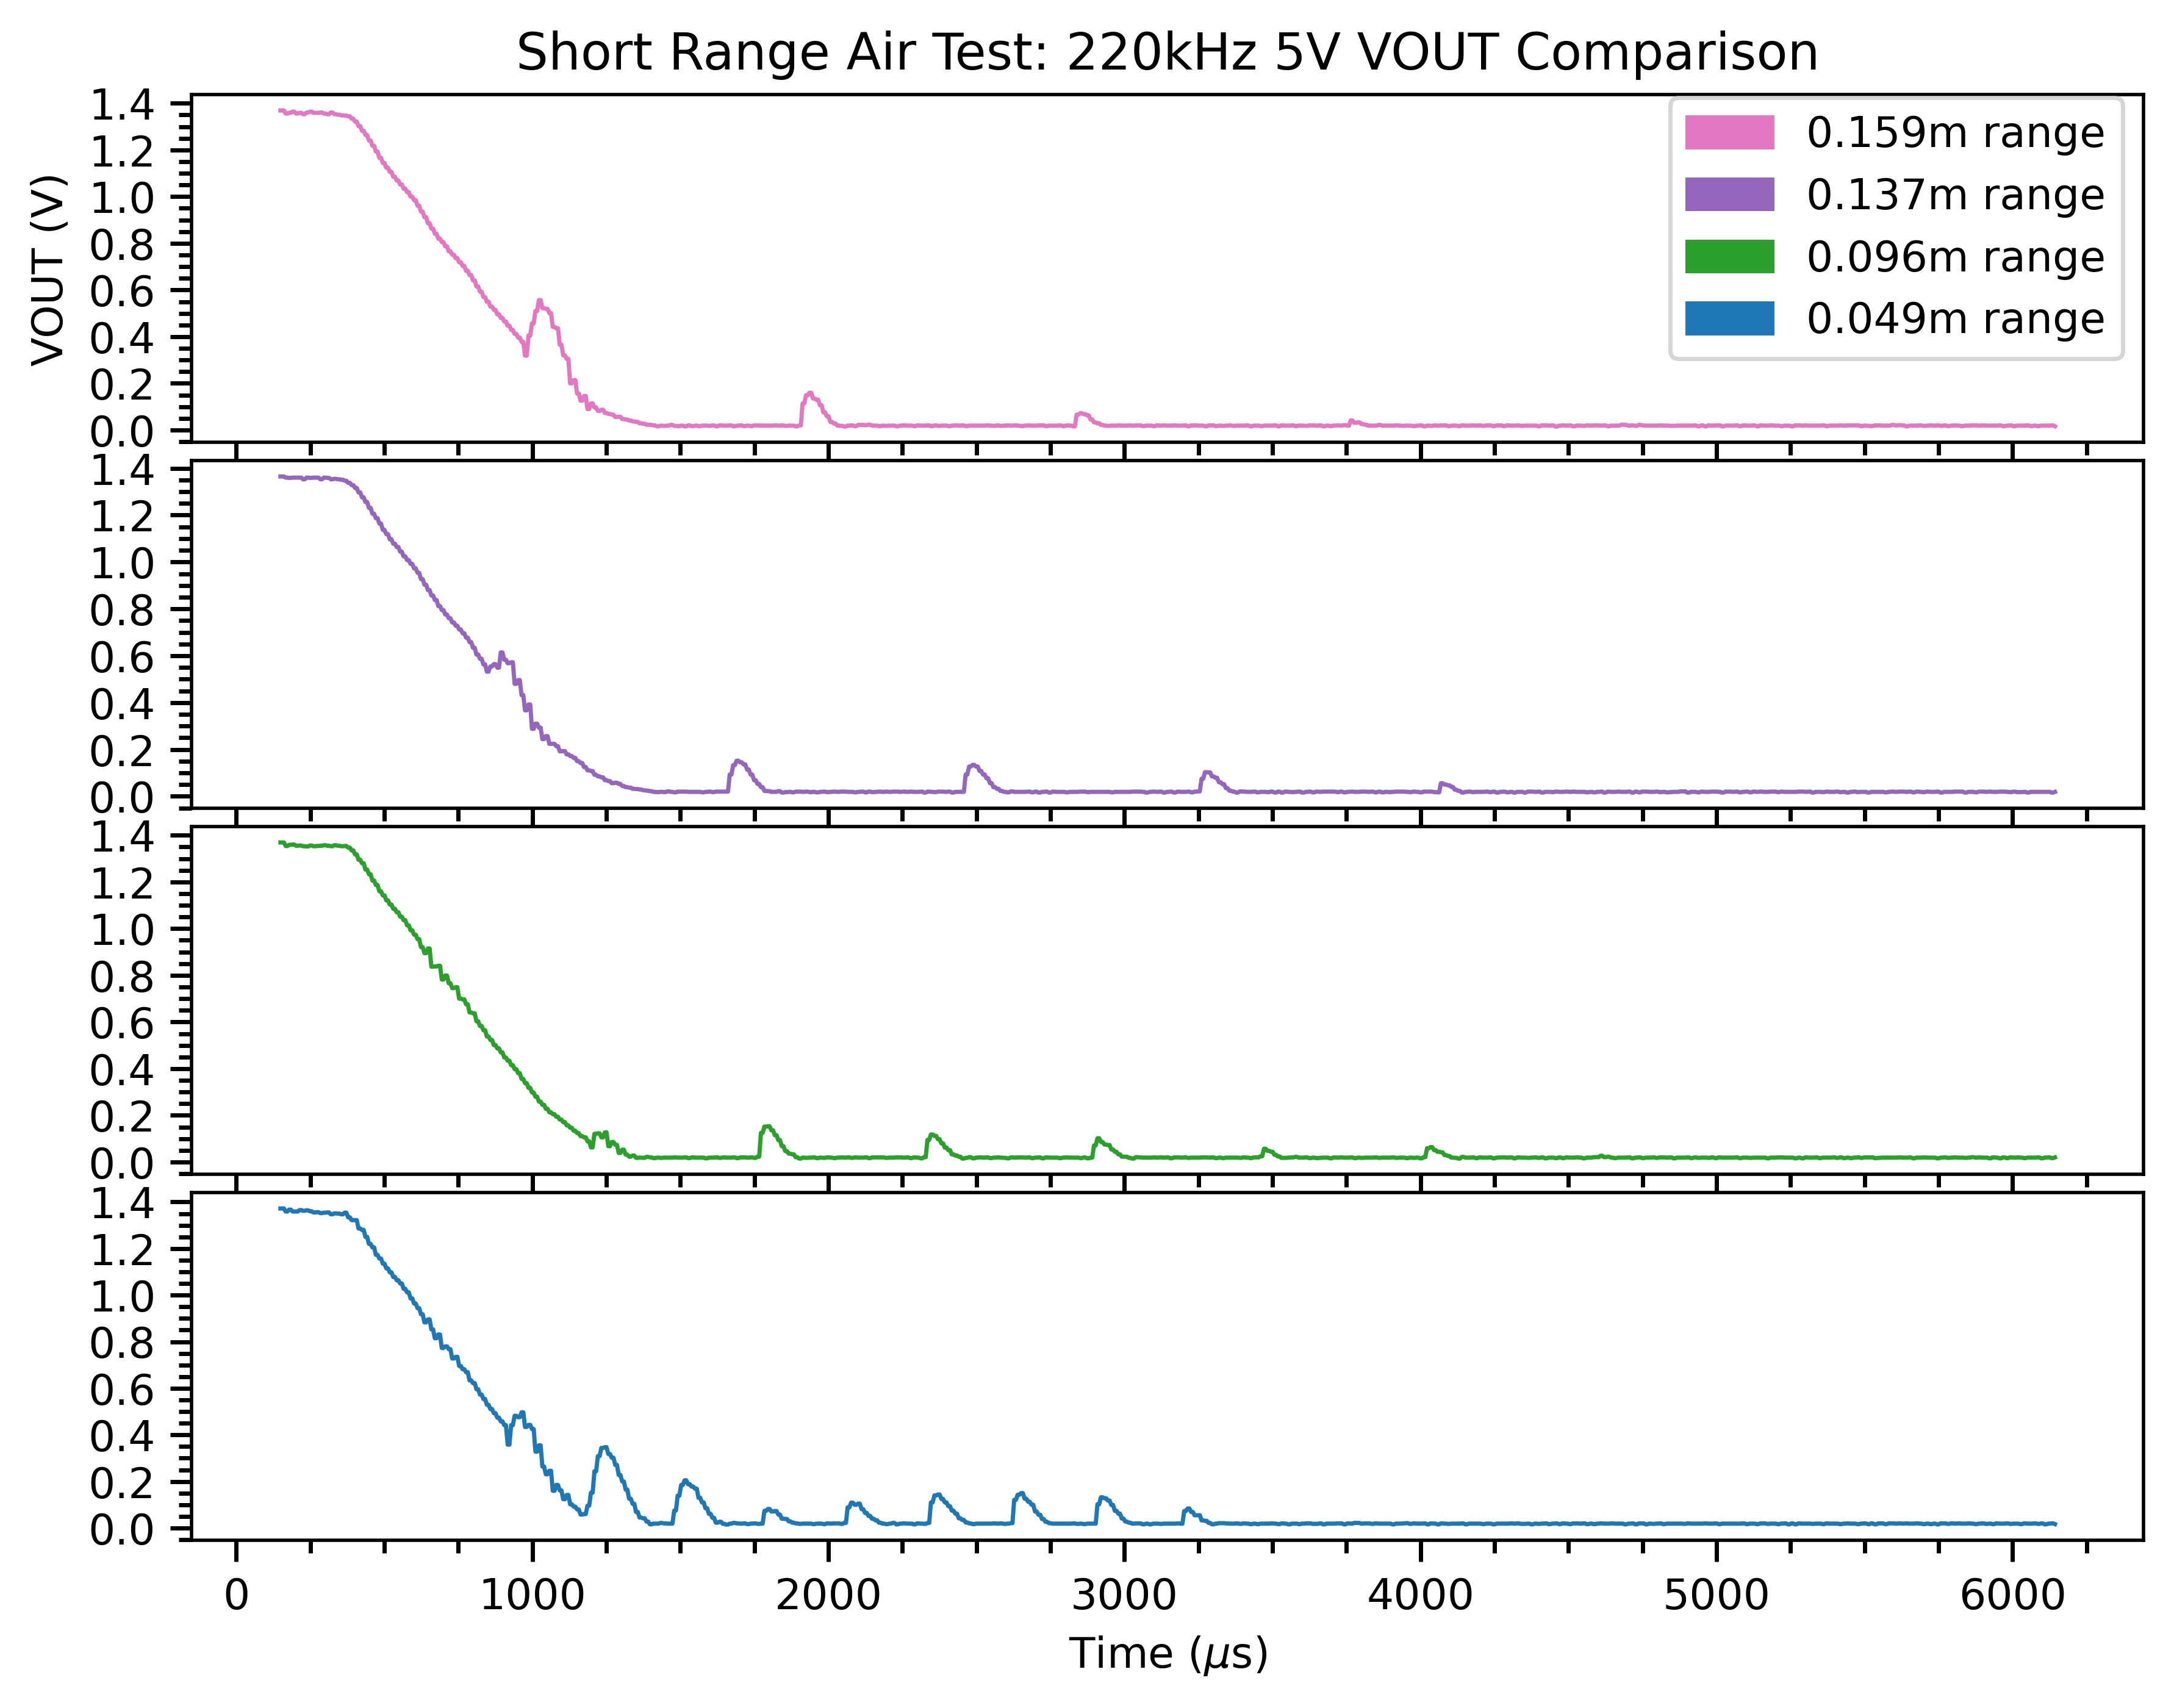
For each measurement, the VOUT waveform was captured from the TUSS Generation III GUI data plotter tool. Four plots show the peaks corresponding to the TUSS4470 conditioned output of the received echo waveform for decreasing ranges (increasing water level). The distances shown in the legend were computed in post processing.
 Figure 3-1 Short Range Air-Coupled Results:
TUSS4470
Figure 3-1 Short Range Air-Coupled Results:
TUSS4470As the range decreases, multiples of the return echo are visible due to decreased attenuation of the ultrasonic pulse between the transducer and target, which allows the wave to reflect back and forth several times before dissipating entirely. The top waveform (0.159m) shows the first echo at the 1 ms mark followed by the second and third reflection. At a certain range, the first echo will fall into the blind zone, where it will be impossible to detect it from ADC samples. In short range applications with a very reflective target, subsequent reflections can be used to measure the ToF. In post processing on this data, ToF was computed as an average of the time between each pair of adjacent return echos. A software threshold was used to detect the beginning of each pulse on VOUT. In applications that require very short range measurements, this method can be down to a range where return echos are too close to distinguish. Note that 4.9cm recorded above is not the minimum range for this device setup. This ToF measurement principle can be applied with a real-time processing algorithm by keeping track of the number of samples between threshold crosses. The echo interrupt available on the OUT4 pin is a less costly option for measuring ToF, however, the echo pulse must reach the minimum interrupt threshold of 0.4V.