SLVAFP1 February 2024 TPS54KB20
2.2 Thermal Performance
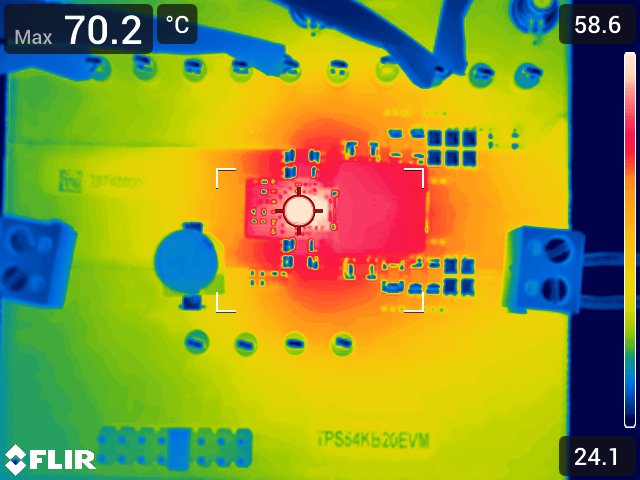
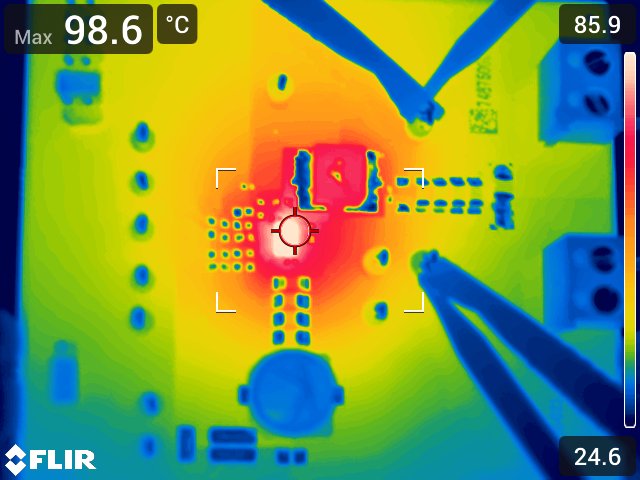
Figure 2-3 and Figure 2-4 show a thermal comparison between TPS54KB20 and TPS54JB20. The measurements were taken under identical conditions: 12V input, 1V output, and internal VCC.
 Figure 2-3 TPS54KB20 Thermal
Characteristics, 800kHz, 20A Load
 Figure 2-4 TPS54JB20 Thermal
Characteristics, 800kHz, 20A Load