SLVUBP9A December 2020 – May 2021 TPSM41625
3 Test Results
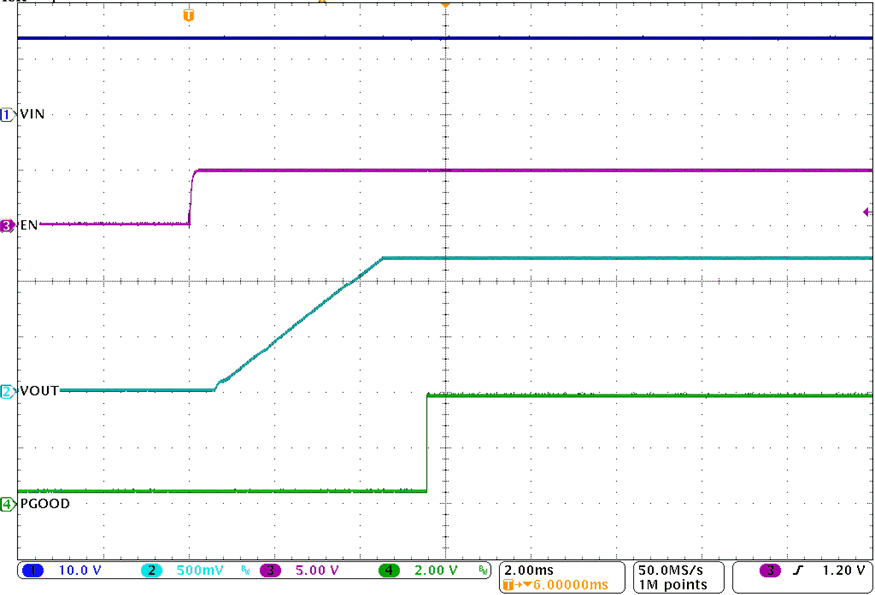
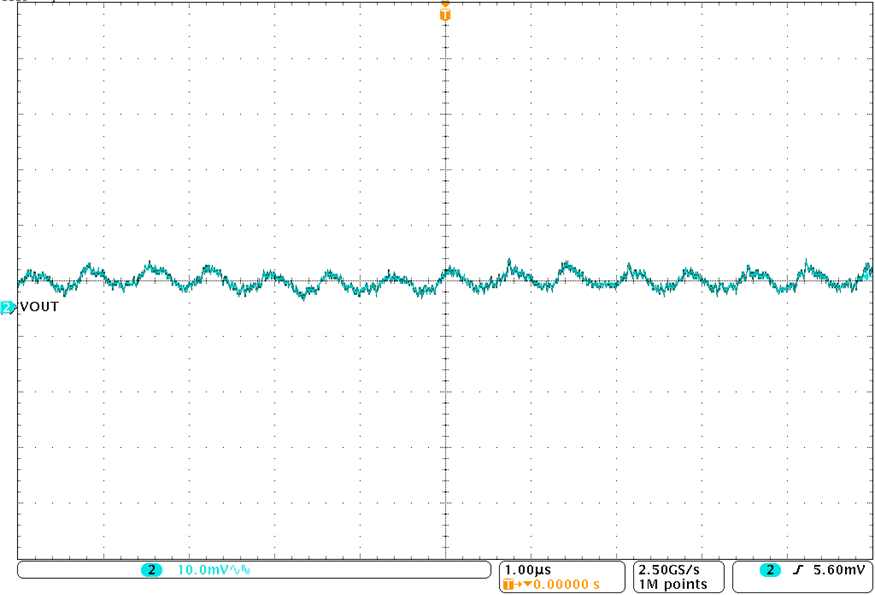
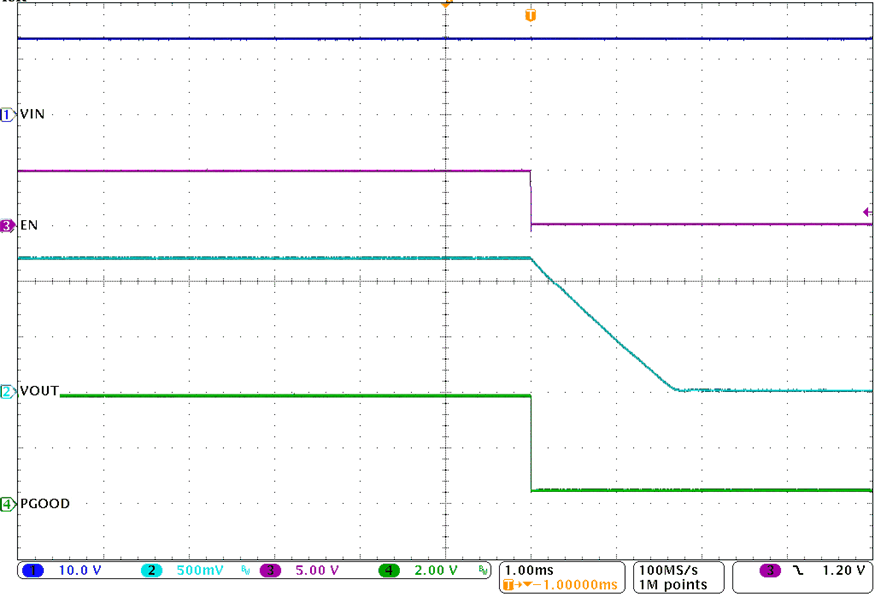
Figure 3-1 and Figure 3-2 demonstrate the enable ON/OFF performance of the EVM. Figure 3-3 shows the typical output voltage ripple with a 25-A load. All figures shown below are under the following conditions: 12-V input voltage, 1.2-V output voltage and a switching frequency of 700 kHz. Additional output capacitor footprints are available on the EVM if an improved load transient response or output voltage ripple is needed. See the data sheet for more information on the respective devices.
 Figure 3-1 ENABLE Start-Up
Waveform
 Figure 3-3 25-A Output Voltage
Ripple
 Figure 3-2 ENABLE Shutdown
Waveform