SLYA051B October 2020 – May 2024 DRV5055 , DRV5055-Q1 , DRV5057 , DRV5057-Q1 , TMAG5170 , TMAG5170-Q1 , TMAG5170D-Q1 , TMAG5173-Q1 , TMAG5273
3 Linear Array Design
Based on the results from the preceding simulation, we can expect that the maximum appropriate sensor spacing is roughly the magnet length of 22 mm. This aligns with the maximum of one sensor with the minimum of the following device. In practice this presents a few challenges. Firstly, air gap, alignment, or sensitivity of the DRV5055 may vary enough to produce measurement gaps. Secondly, the output voltage is nonlinear near the extremes. This makes interpreting the final position difficult. As a result, it is recommended to have overlap between sensors.
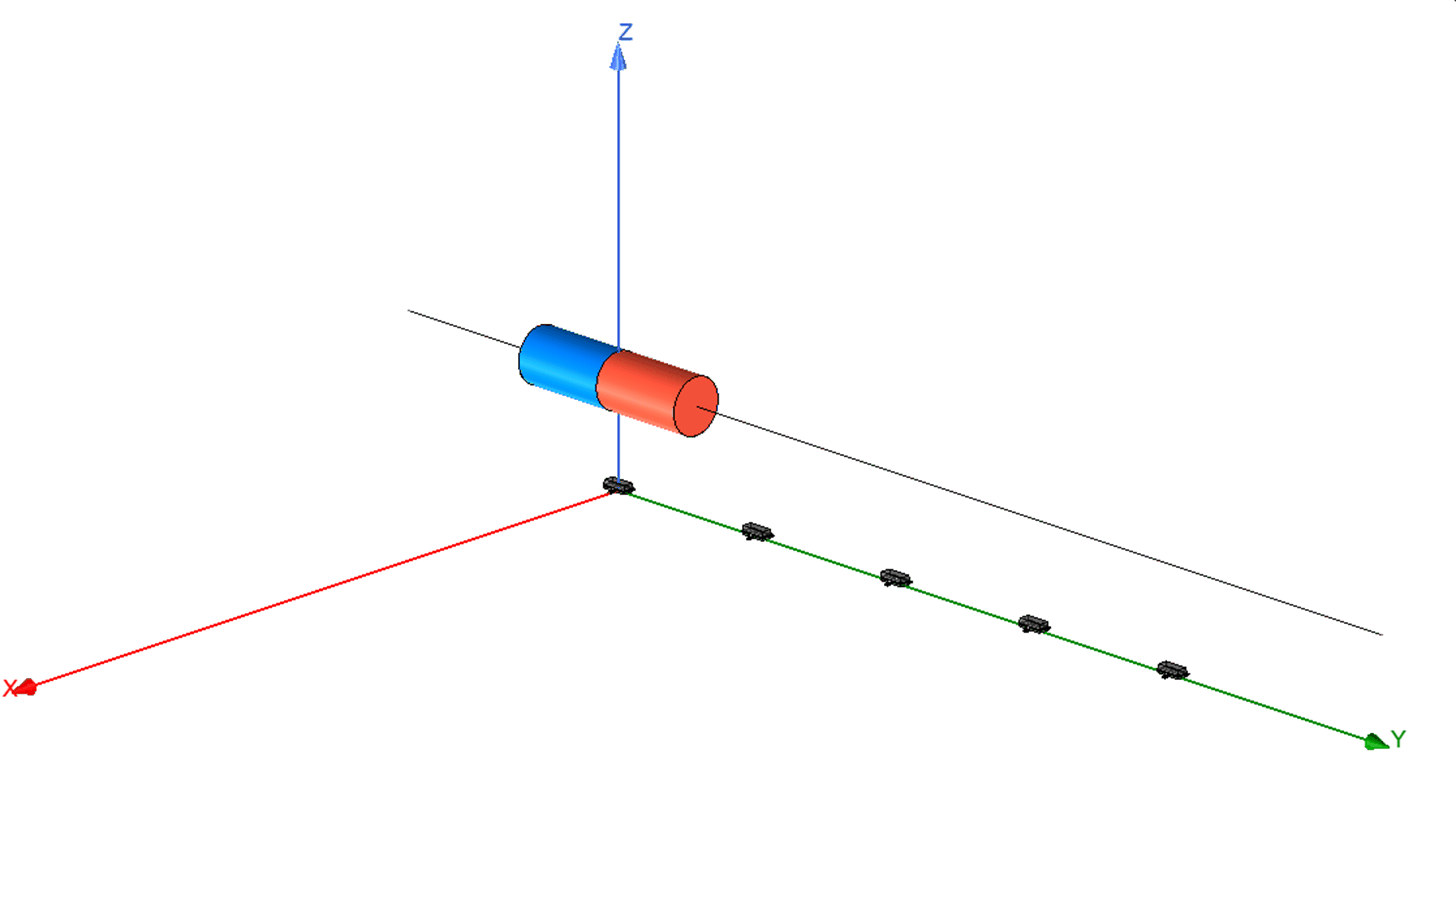
Let us expand the previous setup and consider a linear array of 5 sensors with approximately 20 mm spacing between each sensor.
 Figure 3-1 DRV5055 Linear Array
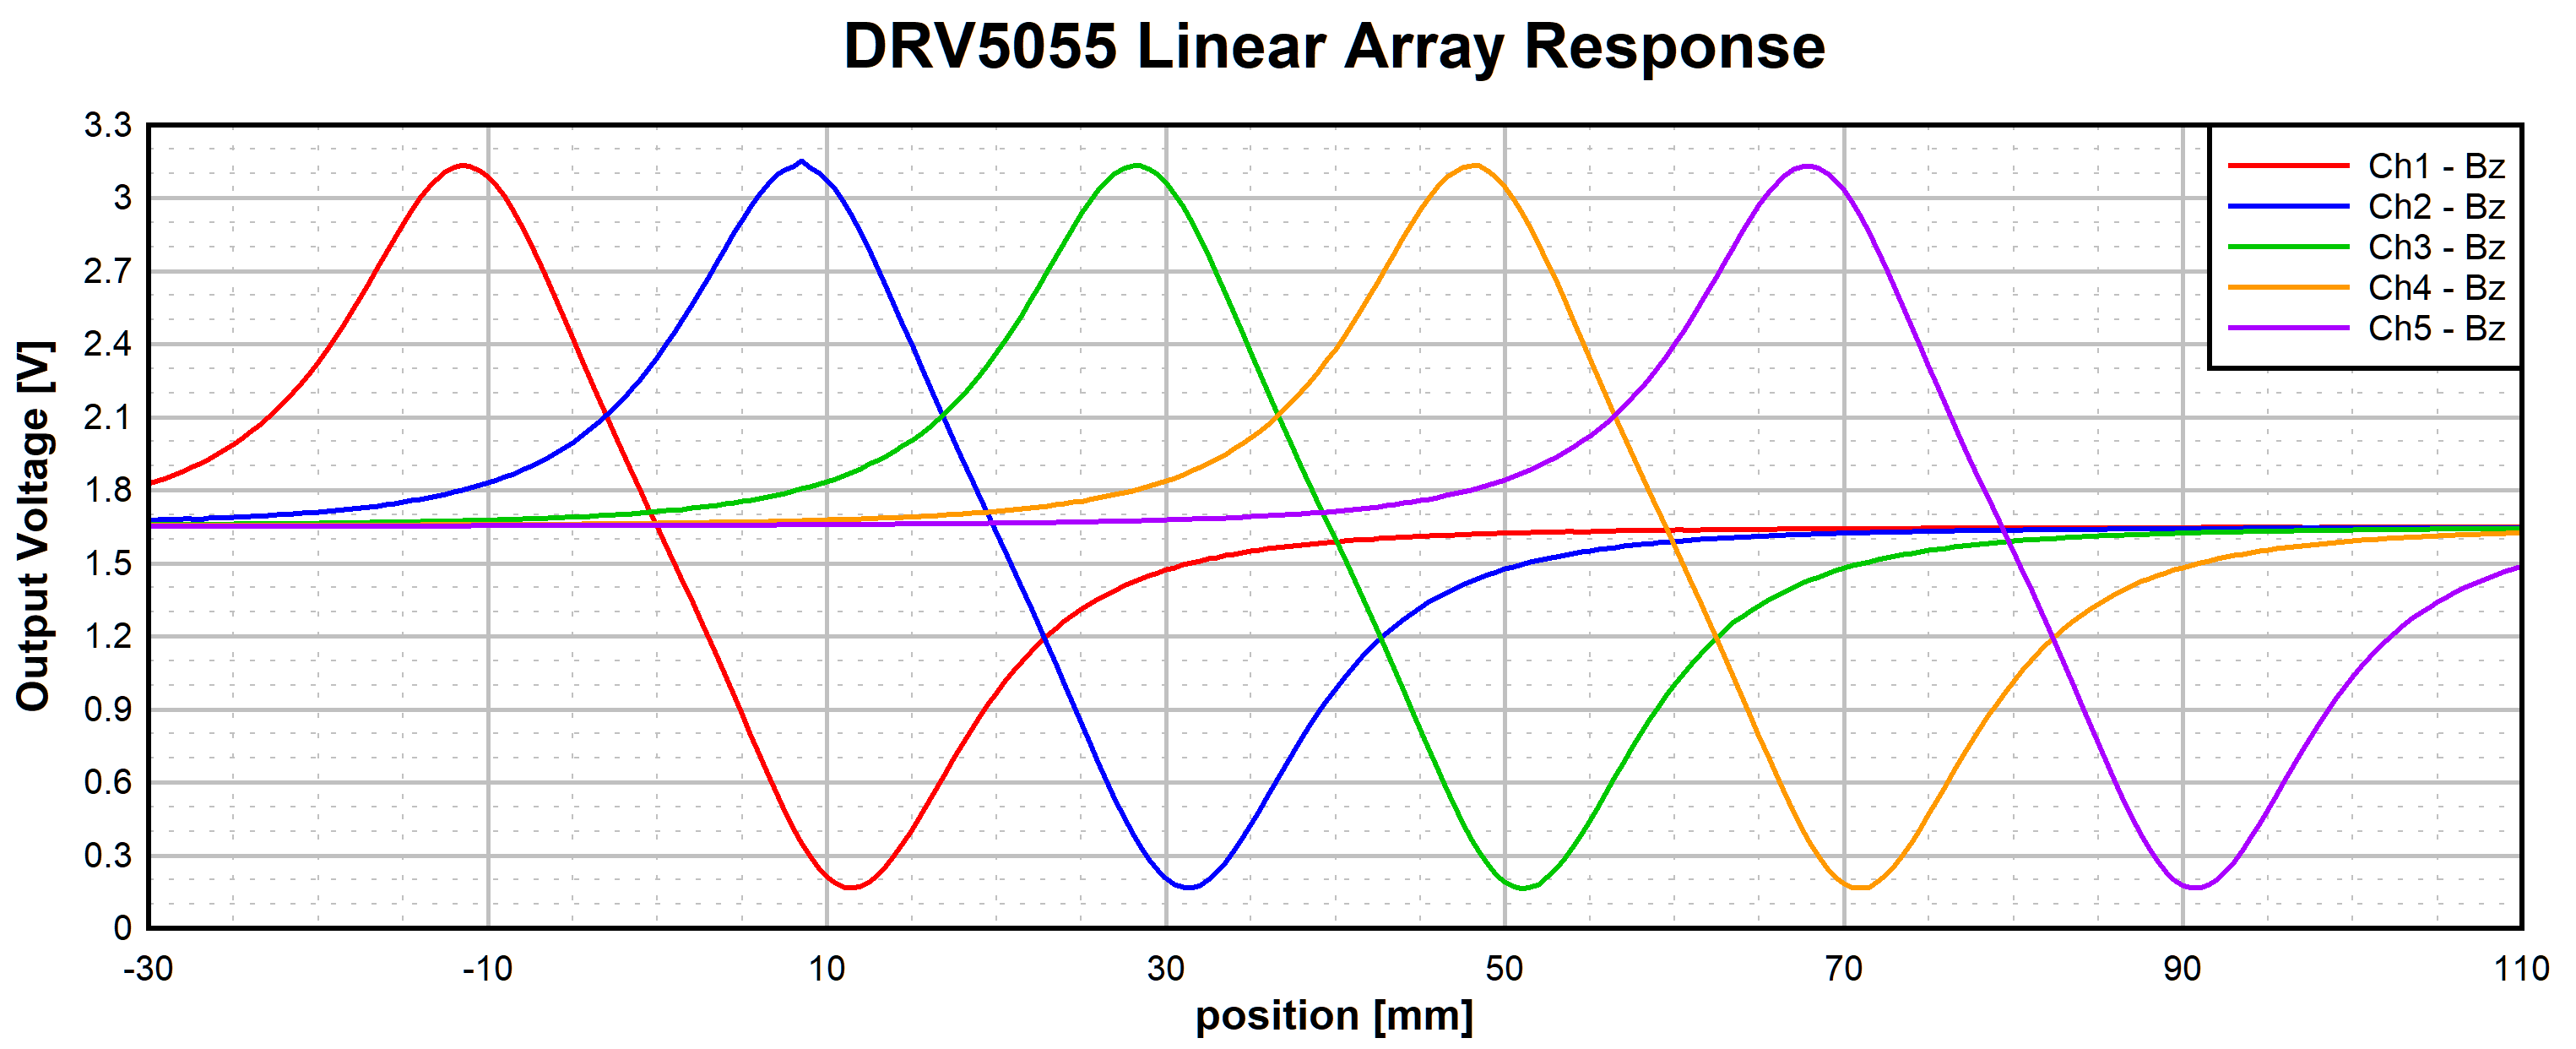
This spacing aligns the peak of one sensor with the linear output region of the adjacent sensor and gives us a total usable range of about 100 mm as shown in DRV5055 Output Response.
 Figure 3-2 DRV5055 Output Response
For the output data to be useful, it must be decoded. The system must decide which sensor output is most relevant at any given time to use for position calculations. An easy algorithm to determine which output should be monitored is as follows:
- Check the output of each device and select the
device with the greatest absolute magnitude.
- Note: In this case the output should be shifted down by 1.65V as this is the mid-range output value for DRV5055 and corresponds to 0 mT B-field.
- If the value from the step above is negative, use
the signal from the sensor to the right. If the output is positive, use the signal
from the sensor to the left. If the device is the first in the array and positive,
then use the signal of that device. Similarly, use the signal from the last device
when it is negative.
- For example, consider the position at 0 displacement which is directly centered over the first sensor. Here the output from the blue trace has the greatest magnitude and is positive. Use the red trace (to the left) to determine location.
- We might also consider the case of 51 mm. The maximum negative output value for the green trace is observed, and calculations should therefore be made using the value from the orange trace (to the right).
- Calculate position based on selection in step 2. This may require obtaining calibration points from each sensor to achieve the highest accuracy. Knowing the start position for each sensor and the slope of the output voltage vs. distance allows the system to stitch the outputs together to produce a final position measurement.