SNOAA47A September 2024 – October 2024 TMP116 , TMP117 , TMP119
3.2 Test Setup
For each test, we quickly stepped up the dissipated power of the device and then sequentially stepped the power down. This is achieved by sharply changing the supply voltage to increase the quiescent current of the device, thereby altering the dissipated power. This fluctuation in power results in a temperature change during the test, allowing us to calculate the system's thermal parameters through constantly monitored internal temperature and power. In these experiments, the temperature flow is opposite to the expected norm: the temperature flow and changes are coming from the object, and the sensor follows the object. Due to the small sensor thermal mass, there is a possibility to heat the sensor quickly, creating a situation close to an ideal thermal step function, allowing the use of Gaussian step equations under specific conditions. The following steps outline the test setup:
- Thermal Head Setup
- Massive copper thermal heads were attached under a stable and controlled temperature of +21°C (close to room temperature) to minimize the influence of convection airflows. This makes sure that the sensor's self-heating during the tests does not affect the thermal head temperature.
- To avoid short circuits of the CB on the bottom side of the PCB, the copper thermal head is covered by 1-mil Kapton® tape to electrically isolate the thermal head from the coupon board.
- Thermal Contact
Optimization
- A tiny layer of thermal grease was applied between the coupon board and the thermal head to improve thermal contact.
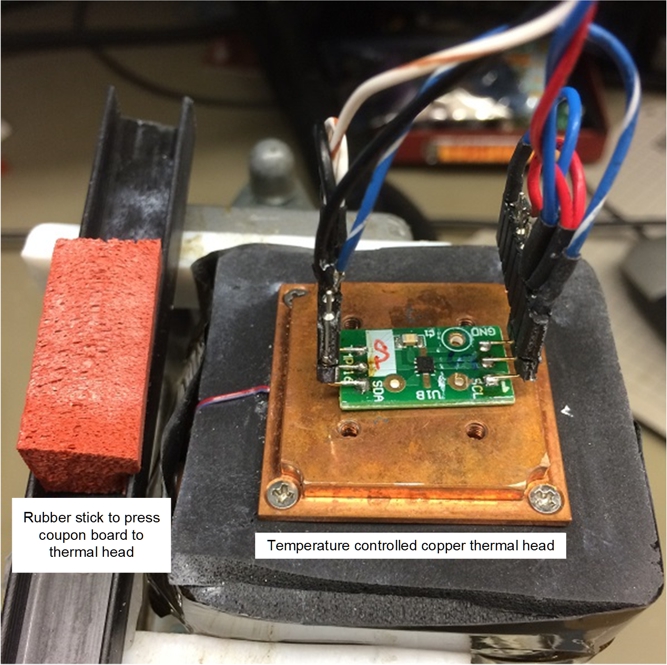
- To stabilize the thermal contact further and prevent temperature leakage from the device under test (DUT) to the surrounding air, the coupon board is pressed to the thermal head by a porous rubber stick with controlled force.
- Test Chamber Conditions
- To avoid the influence of room air movement, the thermal head with the attached coupon board was placed into a closed test chamber and kept there for at least 15 minutes before the test.
- DUT Setup
- Only one DUT is tested at a time to make sure of accuracy.
- Each coupon board has a 0.1µF surface mount voltage supply ceramic capacitor populated on the V+pin and referenced to GND.
- The I2C bus runs at 400kHz with a 3V pullup voltage, which does not change during the test.
- The DUT supply changes during the test in the following steps: 3V → 5.5V → 3V. This leads to a device supply power consumption change: 0.4mW → 5.5mW → 0.4mW. The time on each supply voltage step is 15s.
- The DUT is in continuous conversion mode with 8 internal averaging and no pause between conversions. The temperature data are transferred from DUT every 150ms.
Figure 3-2 shows the test setup, containing the thermal head, an example connected coupon board, and the rubber stick used in the experiments.
 Figure 3-2 Experimental Setup