SPRADH0 August 2024 AM625 , AM6442 , AM69 , TDA4VM
- 1
- Abstract
- Trademarks
- 1Introduction
- 2Evaluation Platform and Methods
- 3Performance Metrics
- 4Optimizations
- 5Summary
- 6References
- 7Appendix A: How to Setup TI Embedded Processors as EtherCAT Controller Using the CODESYS Stack
- 8Appendix B: How to Enable Unlimited Runtime on CODESYS Stack
7.5 How to View Performance Measurements
To view basic cycle time and jitter statistics in table format
- Within the "Devices" window, double click "Task Configuration"
- Click on the "Monitor" tab
To view frame specific statistics
- Within the "Devices" window, double click "EtherCAT_Master (EtherCAT Master)"
- Click on the "Status" tab
To graphically view CPU Load measurements in real-time
- Within the "Devices" window, double click "Task Configuration"
- Click on the "CPU Load" tab. Note that this tab only appears when the CODESYS project is logged in and started
To graphically view cycle time and jitter statistics in real-time
- Add “CmpIecTask” library manager
- Put the following in the "Var" section in your
PLC_PRG
PROGRAM PLC_PRG VAR tTask : Task_Info2; (* Task Info *) aIecTasks : ARRAY[1..20] OF Task_Info2; (* All Task Info *) hCurrentTask : RTS_IEC_HANDLE := SysTypes.RTS_INVALID_HANDLE; Result : RTS_IEC_RESULT; (* Result Code *) pTaskInfo : POINTER TO Task_Info2; hIecTask : RTS_IEC_HANDLE; pResult : POINTER TO RTS_IEC_RESULT; ... END_VAR - Place the following text in the body of
the PLC_PRG
... (* Retrieve information about the current task *) IF hCurrentTask = SysTypes.RTS_INVALID_HANDLE THEN hCurrentTask := IecTaskGetCurrent(pResult:=ADR(Result)); pTaskInfo := IecTaskGetInfo3(hIecTask:=hCurrentTask, pResult:=ADR(Result)); END_IF ... -
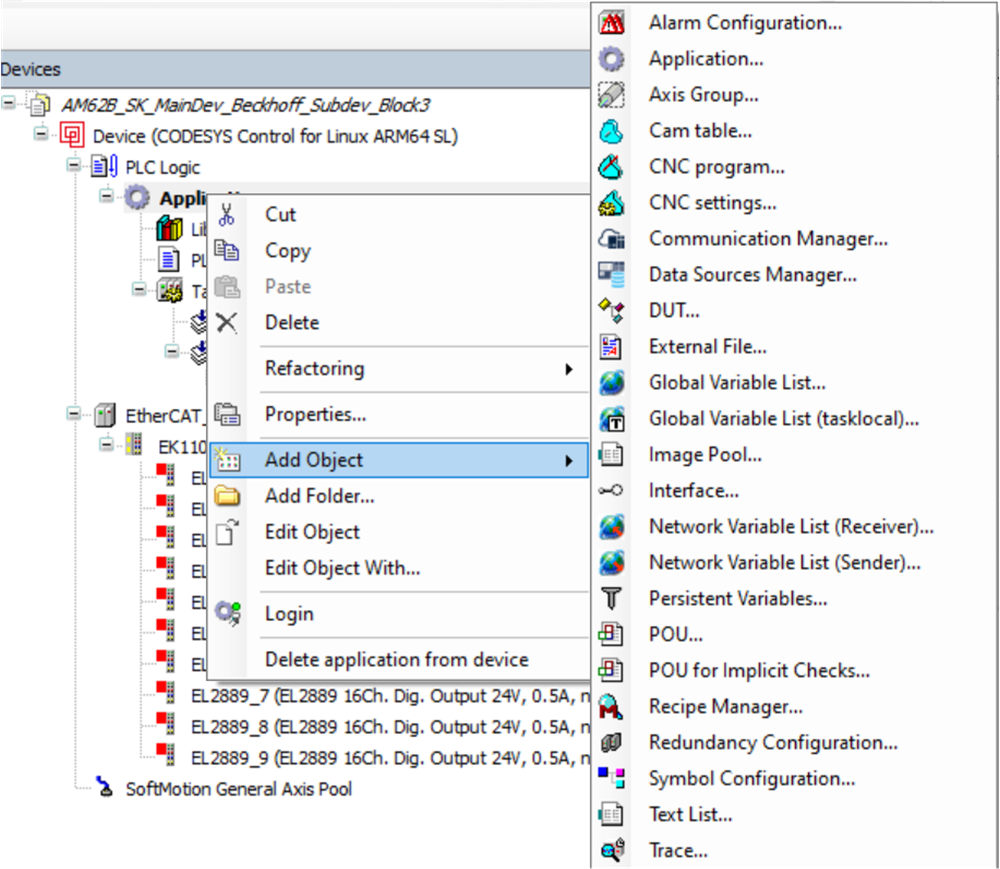
Add a Trace object to your CODESYS project
- Right click on “Application” on the left hand panel
- Select “Add Object” >
“Trace”
 Figure 7-4 CODESYS Add Trace
Object
 - Under "Task for Trace Recording" select the Task containing PLC_PRG
- Select "pTaskInfo->cycle
time" and "pTaskInfo->jitter" to trace in the Trace object
- Double click on the “Trace” object under “Application” in the left hand panel
- Right click anywhere on the Trace object graph and select “Add Variable”
- Next to the “Variable” entry, click on the 3 dots
- Select the variable corresponding to "pTaskInfo->cycle time" and "pTaskInfo->jitter"
To start the graphical interface in Trace object
- Right click anywhere on the Trace object graph and select “Download Trace”
To save the trace object content as csv or txt file
- Right click anywhere on the Trace object graph and select “Save Trace”