SPRADP0 December 2024 AM2631 , AM2631-Q1 , AM2632 , AM2632-Q1 , AM2634 , AM2634-Q1 , AM263P4 , AM263P4-Q1
7 Debugging with Trace32 Software
The Lauterbach hardware, AM26x device, and the application are prepared to be traced. To extract trace for an application, follow the steps below:
- Launch the TRACE32 software.
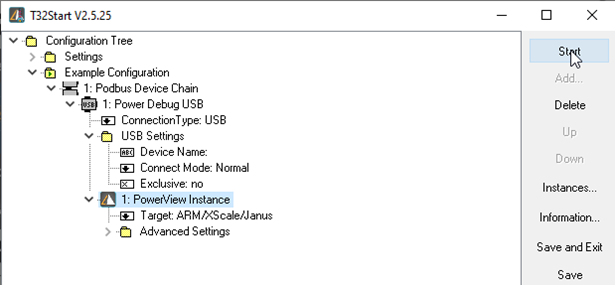
- From the T32Start screen, select the PowerView Instance and click on Start.
 Figure 7-1 T32 Start Window
 - Set the device in OSPI, QSPI boot mode and power cycle your device (HSEC Dock board).
- Click on File → Run Script → Select the .cmm script am263px-trace.cmm.
- First, this file resets the CPU, attaches to the system bus and unlocks MSS_CTRL registers, then eclipse ROM and runs the R5F core. The file then prompts users to choose an application binary to debug. Browse the file explorer and select the file.
- The script then configures trace clock source, IOMUX, and I2C to route signals to the docking station.
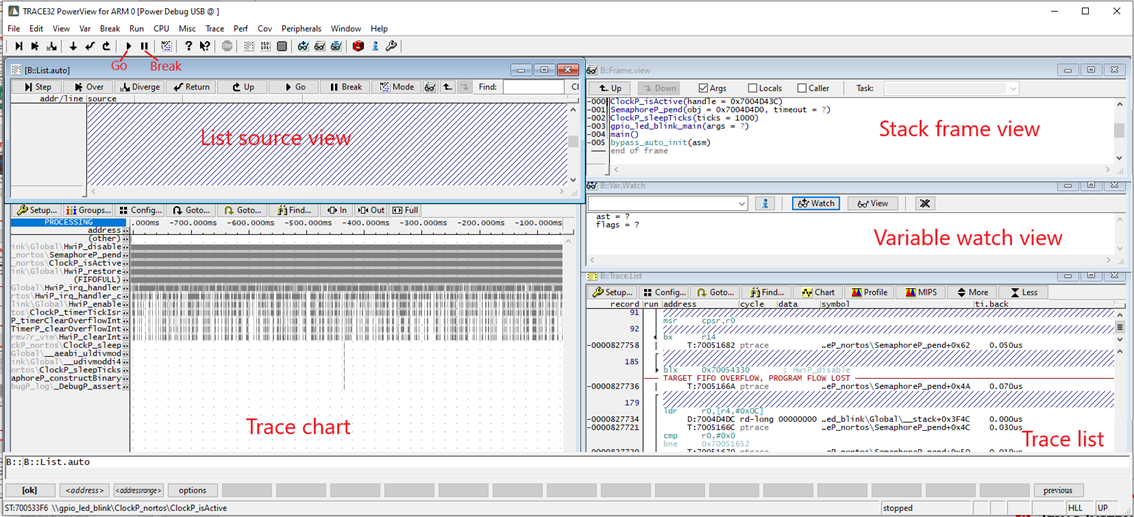
- The script opens up windows to show the debug trace.
 Figure 7-2 Trace Result Windows
See Figure 8-1 for the debug trace of GPIO Led blink example on the AM263Px controlCard.