SPRUHJ0C April 2013 – October 2021 TMS320F28068M , TMS320F28069-Q1 , TMS320F28069M , TMS320F28069M-Q1
5.2.2 Reference Tracking
Reference tracking tests how well the controller follows a changing target speed. The two metrics to evaluate in this testing are the maximum error and the absolute average error. The maximum speed error shows how much the controller overshoots while changing speeds. This is an indication of how aggressively your controller is tuned. If your controller is not tuned aggressively enough, the speed will overshoot the target, and take a long time to recover. If the controller is tuned too aggressively it will overshoot, and then oscillate as it settles on the goal speed. If the controller is correctly tuned, it will minimally overshoot and then smoothly return to the goal speed.
Absolute average error is an average of the absolute value of the instantaneous speed error over the entire profile. This measure shows the amount of deviation throughout the entire profile. It takes into account all of the little errors as the motor is running. If the controller is tuned too aggressively it will result in larger absolute average error because the controller will be oscillating throughout the profile. If the controller is not tuned aggressively enough, it will result in a larger absolute average error because the motor is continuously lagging the profile.
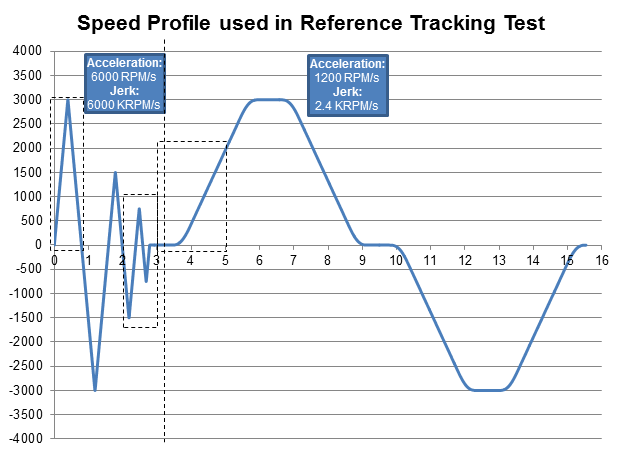
A tracking profile was created to exercise the motor in a repeatable a pattern. The profile was used to compare the performance of SpinTAC and PI controllers. The profile included quick transitions as well as gentle sweeping transitions. Figure 6-5 is a plot of the speed profile used during the reference tracking tests. The blocked off areas are areas where additional plots will be shown detailing the differences between the SpinTAC and PI controllers.
 Figure 5-5 Speed Profile Used During Reference Tracking Test
There are some differences between the SpinTAC and PI controller that should be called out and evaluated in addition to the absolute average error and maximum error of the profile tracking. Figure 6-6 shows how the PI controller greatly overshoots the speed reference when it makes a very drastic change. It then takes quite a bit of time to recover from that initial error, while the SpinTAC controller has no problems with the drastic reference change.
 Figure 5-6 Large Overshoot for PI Controller During Reference Tracking
Figure 6-7 shows how the PI controller falls behind the reference as the drastic changes in the reference continue. The PI controller cannot keep up, while the SpinTAC controller has no difficultly in accurately tracking the speed reference.
 Figure 5-7 Speed Tracking Error for PI Controller During Reference Tracking
When starting from zero speed with a slow trajectory change, the PI controller has more difficulty than the SpinTAC controller. This is due to the SpinTAC controller's superior ability to track a changing reference signal. Figure 6-8 shows an example of this from the reference tracking test.
It is important to test multiple speeds and accelerations in your profile as well as multiple different loads. Speed controllers have different performance characteristics when placed into different situations. In order to properly evaluate the effectiveness of your speed controller, tests should be conducted across the entire application range. This includes when you design the profile for testing. Care needs to be taken to ensure that the application speeds and accelerations are built into the profile. The results of these tests will inform you if your controller will meet the application specifications or if your controller needs to be tuned multiple times for different operating points. Notice wide range of speeds and accelerations that are tested in Figure 6-5.
It is also important to be able to create repeatable profiles. Creating a repeatable profile can be done using SpinTAC Move and SpinTAC Plan (the InstaSPIN-FOC and InstaSPIN-MOTION User's Guide provides detailed information on SpinTAC Move and SpinTAC Plan and lab projects are available in the MotorWare repository). Repeatable profiles are required so that all controllers are tested using the same reference in the same order and for the same length of time. This ensures that test conditions are as identical as possible. The profile for this test was made using SpinTAC Move and SpinTAC Plan to ensure that an identical profile was presented to both the SpinTAC and PI controllers.
 Figure 5-8 Startup Error From Zero Start for PI Controller
The following parameters were measured:
- Absolute Average Speed Error: The positive or negative deviation from the goal speed over the entire speed profile.
- Maximum Speed Error: The maximum deviation from the goal speed during the speed profile.
| Trapezoidal Curve | st-Curve | |||||
|---|---|---|---|---|---|---|
| SpinTAC | PI | SpinTAC Advantage (percentage improvement over PI) | SpinTAC | PI | SpinTAC Advantage (percentage improvement over PI) | |
| Teknic Motor | ||||||
| Abs Avg Error (rpm) | 6.01 | 19.94 | 69.86 | 5.98 | 19.51 | 69.35 |
| Max Error (rpm) | 266.06 | 430.00 | 38.13 | 263.00 | 334.71 | 21.42 |
| Estun Motor | ||||||
| Abs Avg Error (rpm) | 5.39 | 16.11 | 66.54 | 5.73 | 16.124 | 64.46 |
| Max Error (rpm) | 248.29 | 312.74 | 20.61 | 181.64 | 307.61 | 40.95 |