SPRUHJ1I January 2013 – October 2021 TMS320F2802-Q1 , TMS320F28026-Q1 , TMS320F28026F , TMS320F28027-Q1 , TMS320F28027F , TMS320F28027F-Q1 , TMS320F28052-Q1 , TMS320F28052F , TMS320F28052F-Q1 , TMS320F28052M , TMS320F28052M-Q1 , TMS320F28054-Q1 , TMS320F28054F , TMS320F28054F-Q1 , TMS320F28054M , TMS320F28054M-Q1 , TMS320F2806-Q1 , TMS320F28062-Q1 , TMS320F28062F , TMS320F28062F-Q1 , TMS320F28068F , TMS320F28068M , TMS320F28069-Q1 , TMS320F28069F , TMS320F28069F-Q1 , TMS320F28069M , TMS320F28069M-Q1
- 1 Read This First
-
1 Introduction
- 1.1 An Overview of InstaSPIN-FOC™ and FAST™
- 1.2
An Overview of InstaSPIN-MOTION™ and SpinTAC™
- 1.2.1 InstaSPIN-MOTION™ Key Capabilities and Benefits
- 1.2.2 InstaSPIN-MOTION™ Block Diagrams
- 1.2.3 Application Examples
- 2 Quick Start Kits - TI Provided Software and Hardware
-
3 InstaSPIN™ and MotorWare™
- 3.1 Overview
- 3.2 MotorWare™ Directory Structure
- 3.3 MotorWare™ Object-Oriented Design
- 3.4
InstaSPIN-FOC™ API
- 3.4.1
Controller API Functions – ctrl.c, ctrl.h,
CTRL_obj.h
- 3.4.1.1 CTRL Enumerations and Structures
- 3.4.1.2 CTRL State Control and Error Handling
- 3.4.1.3
CTRL Get Functions
- CTRL_getCount_current ()
- CTRL_getCount_isr ()
- CTRL_getCount_speed ()
- CTRL_getCount_state ()
- CTRL_getCount_traj ()
- CTRL_getCtrlFreq ()
- CTRL_getCtrlPeriod_sec ()
- CTRL_getErrorCode ()
- CTRL_getEstHandle ()
- CTRL_getFlag_enableCtrl ()
- CTRL_getFlag_enableDcBusComp ()
- CTRL_getFlag_enablePowerWarp ()
- CTR CTRL_getFlag_enableOffset ()
- CTRL_getFlag_enableSpeedCtrl ()
- CTRL_getFlag_enableUserMotorParams ()
- CTRL_getGains ()
- CTRL_getIab_filt_pu ()
- CTRL_getIab_filt_addr ()
- CTRL_getIab_in_addr ()
- CTRL_getIab_in_pu ()
- CTRL_getId_in_pu ()
- CTRL_getId_ref_pu ()
- CTRL_getIdq_in_addr ()
- CTRL_getIdq_in_pu ()
- CTRL_getIdq_ref_pu ()
- CTRL_getIdRated_pu ()
- CTRL_getIq_in_pu ()
- CTRL_getIq_ref_pu ()
- CTRL_getKi ()
- CTRL_getKd ()
- CTRL_getKp ()
- CTRL_getLhf ()
- CTRL_getMagCurrent_pu ()
- CTRL_getMaxVsMag_pu ()
- CTRL_getMaximumSpeed_pu ()
- CTRL_getMotorRatedFlux ()
- CTRL_getMotorType ()
- CTRL_getNumCtrlTicksPerCurrentTick ()
- CTRL_getNumCtrlTicksPerSpeedTick ()
- CTRL_getNumCtrlTicksPerTrajTick ()
- CTRL_getNumIsrTicksPerCtrlTick ()
- CTRL_getRefValue_pu ()
- CTRL_getRhf ()
- CTRL_getRoverL ()
- CTRL_getSpd_max_pu ()
- CTRL_getSpd_out_addr ()
- CTRL_getSpd_out_pu ()
- CTRL_getSpd_ref_pu ()
- CTRL_getSpd_int_ref_pu ()
- CTRL_getState ()
- CTRL_getTrajFreq ()
- CTRL_getTrajPeriod_sec ()
- CTRL_getTrajStep ()
- CTRL_getUi ()
- CTRL_getVab_in_pu ()
- CTRL_getVab_out_addr ()
- CTRL_getVab_out_pu ()
- CTRL_getVd_out_addr ()
- CTRL_getVd_out_pu ()
- CTRL_getVdq_out_addr ()
- CTRL_getVdq_out_pu ()
- CTRL_getVersion ()
- CTRL_getVq_out_addr ()
- CTRL_getVq_out_pu ()
- CTRL_getWaitTime ()
- 3.4.1.4 CTRL Counter Functions
- 3.4.1.5
CTRL Set Functions
- CTRL_setCtrlFreq_Hz ()
- CTRL_setCtrlFreq_sec ()
- CTRL_setErrorCode ()
- CTRL_setEstParams ()
- CTRL_setFlag_enableCtrl ()
- CTRL_setFlag_enableDcBusComp ()
- CTRL_setFlag_enablePowerWarp ()
- CTRL_setFlag_enableOffset ()
- calibrationCTRL_setFlag_enableSpeedCtrl ()
- CTRL_setFlag_enableUserMotorParams ()
- CTRL_setGains ()
- CTRL_setIab_in_pu ()
- CTRL_setIab_filt_pu ()
- CTRL_setId_ref_pu ()
- CTRL_setIdq_in_pu ()
- CTRL_setIdq_ref_pu ()
- CTRL_setIdRated_pu ()
- CTRL_setIq_ref_pu ()
- CTRL_setKd ()
- CTRL_setKi ()
- CTRL_setKp ()
- CTRL_setLhf ()
- CTRL_setMagCurrent_pu ()
- CTRL_setMaxVsMag_pu ()
- CTRL_setMaxAccel_pu ()
- CTRL_setMaximumSpeed_pu ()
- CTRL_setParams()
- CTRL_setNumCtrlTicksPerCurrentTick ()
- CTRL_setNumCtrlTicksPerSpeedTick ()
- CTRL_setNumCtrlTicksPerTrajTick ()
- CTRL_setNumIsrTicksPerCtrlTick ()
- CTRL_setRhf ()
- CTRL_setRoverL ()
- CTRL_setSpdMax ()
- CTRL_setSpd_max_pu ()
- CTRL_setSpd_out_pu ()
- CTRL_setSpd_ref_pu ()
- CTRL_setSpd_ref_krpm ()
- CTRL_setState ()
- CTRL_setTrajFreq_Hz ()
- CTRL_setTrajPeriod_sec ()
- CTRL_setUi ()
- CTRL_setupClarke_I ()
- CTRL_setupClarke_V ()
- CTRL_setupEstIdleState ()
- CTRL_setupEstOnLineState ()
- CTRL_setUserMotorParams ()
- CTRL_setVab_in_pu ()
- CTRL_setVab_out_pu ()
- CTRL_setVdq_out_pu ()
- CTRL_setWaitTimes ()
- CTRL_setup ()
- CTRL_setupCtrl ()
- CTRL_setupEst ()
- CTRL_setupTraj ()
- 3.4.1.6 CTRL Run and Compute Functions
- 3.4.2
Estimator API Functions – FAST™ Library – est.h,
est_states.h
- 3.4.2.1 EST Enumerations and Structures
- 3.4.2.2
EST Set Functions
- EST_setRsOnLineId_pu ()
- EST_setAngle_pu ()
- EST_setDcBus_pu ()
- EST_setDir_qFmt ()
- EST_setFe_neg_max_pu ()
- EST_setFe_pos_min_pu ()
- EST_setFlag_enableFluxControl ()
- EST_setFlag_enableForceAngle ()
- EST_setFlag_enableRsOnLine ()
- EST_setFlag_enableRsRecalc ()
- EST_setFlag_estComplete ()
- EST_setFlag_updateRs ()
- EST_setForceAngleDelta_pu ()
- EST_setFreqB0_lp_pu ()
- EST_setFreqBeta_lp_pu ()
- EST_setFullScaleCurrent ()
- EST_setFullScaleFlux ()
- EST_setFullScaleFreq ()
- EST_setFullScaleInductance ()
- EST_setFullScaleResistance ()
- EST_setFullScaleVoltage ()
- EST_setIdle ()
- EST_setIdle_all ()
- EST_setId_ref_pu ()
- EST_setIdRated_pu ()
- EST_setIq_ref_pu ()
- EST_setLs_d_pu ()
- EST_setLs_delta_pu ()
- EST_setLs_dq_pu ()
- EST_setLs_q_pu ()
- EST_setLs_qFmt ()
- EST_setMaxAccel_pu ()
- EST_setMaxAccel_est_pu ()
- EST_setMaxCurrentSlope_pu ()
- EST_setMaxCurrentSlope_PowerWarp_pu ()
- EST_setRr_pu ()
- EST_setRr_qFmt ()
- EST_setRs_delta_pu ()
- EST_setRsOnLine_pu ()
- EST_setRsOnLine_qFmt ()
- EST_setRsOnLineFilterParams ()
- EST_setRsOnLineId_mag_pu ()
- EST_setRs_pu ()
- EST_setRs_qFmt ()
- EST_updateId_ref_pu ()
- 3.4.2.3
EST Get Functions
- EST_get_krpm_to_pu_sf ()
- EST_get_pu_to_krpm_sf ()
- EST_getAngle_pu ()
- EST_getDcBus_pu ()
- EST_ErrorCode_e EST_getErrorCode ()
- EST_getFe ()
- EST_getFe_pu ()
- EST_getFlag_enableForceAngle ()
- EST_getFlag_enableRsOnLine ()
- EST_getFlag_enableRsRecalc ()
- EST_getFlag_estComplete ()
- EST_getFlag_updateRs ()
- EST_getFlux_VpHz ()
- EST_getFlux_Wb ()
- EST_getFlux_pu ()
- EST_getFm ()
- EST_getFm_pu ()
- EST_getForceAngleDelta_pu ()
- EST_getForceAngleStatus ()
- EST_getFreqB0_lp_pu ()
- EST_getFreqBeta_lp_pu ()
- EST_getFslip ()
- 280
- EST_getFslip_pu ()
- EST_getFullScaleCurrent ()
- EST_getFullScaleFlux ()
- EST_getFullScaleFreq ()
- EST_getFullScaleInductance ()
- EST_getFullScaleResistance ()
- EST_getFullScaleVoltage ()
- EST_getIdRated ()
- EST_getIdRated_pu ()
- EST_getIdRated_indEst_pu ()
- EST_getIdRated_ratedFlux_pu ()
- EST_getLr_H ()
- EST_getLr_pu ()
- EST_getLr_qFmt ()
- EST_getLs_d_H ()
- EST_getLs_d_pu ()
- EST_getLs_delta_pu ()
- EST_getLs_dq_pu ()
- EST_getLs_q_H ()
- EST_getLs_q_pu ()
- EST_getLs_qFmt ()
- EST_getLs_max_pu ()
- EST_getLs_min_pu ()
- EST_getLs_coarse_max_pu ()
- EST_getMaxAccel_pu ()
- EST_getMaxAccel_est_pu ()
- EST_getMaxCurrentSlope_pu ()
- EST_getMaxCurrentSlope_PowerWarp_pu ()
- EST_getOneOverDcBus_pu ()
- EST_getRr_Ohm ()
- EST_getRr_pu ()
- EST_getRr_qFmt ()
- EST_getRs_delta_pu ()
- EST_getRs_Ohm ()
- EST_getRs_pu ()
- EST_getRs_qFmt ()
- EST_getRs_qFmt ()
- EST_getRsOnLine_Ohm ()
- EST_getRsOnLine_pu ()
- EST_getRsOnLineId_mag_pu ()
- EST_getRsOnLineId_pu ()
- EST_getSpeed_krpm ()
- EST_getSignOfDirection ()
- EST_getSpeed_krpm ()
- EST_getState ()
- EST_getTorque_lbin ()
- EST_getTorque_Nm ()
- EST_getDir_qFmt ()
- 3.4.2.4 EST Run and Compute Functions
- 3.4.2.5 EST Counter Functions
- 3.4.2.6 EST State Control and Error Handling Functions
- 3.4.3
Hardware Abstraction Layer (HAL) API Functions – hal.c, hal.h, hal_obj.h
- 3.4.3.1 HAL Enumerations and Structures
- 3.4.3.2
HAL – ADC and AFE
- HAL_setupAdcs ()
- HAL_setupAfe ()
- HAL_acqAdcInt ()
- HAL_readAdcData()
- HAL_updateAdcBias ()
- HAL_setBias ()
- HAL_getBias ()
- HAL_cal ()
- HAL_AdcCalConversion ()
- HAL_AdcOffsetSelfCal ()
- HAL_getAdcSocSampleDelay ()
- HAL_setAdcSocSampleDelay ()
- HAL_getCurrentScaleFactor ()
- HAL_setCurrentScaleFactor ()
- HAL_getVoltageScaleFactor ()
- HAL_setVoltageScaleFactor ()
- HAL_getNumCurrentSensors ()
- HAL_setNumCurrentSensors ()
- HAL_getNumVoltageSensors ()
- HAL_setNumVoltageSensors ()
- 377
- HAL_getOffsetBeta_lp_pu ()
- HAL_setOffsetBeta_lp_pu ()
- HAL_setOffsetInitCond ()
- HAL_getOffsetValue ()
- HAL_setOffsetValue ()
- HAL_runOffsetEst ()
- 3.4.3.3 HAL – PWM and PWM-DAC
- 3.4.3.4 HAL – CPU Timers
- 3.4.3.5 HAL – GPIO and LED
- 3.4.3.6
HAL – Miscellaneous
- HAL_init()
- HAL_initIntVectorTable ()
- HAL_setParams ()
- HAL_setupFlash ()
- HAL_setupPie ()
- HAL_setupPll ()
- HAL_setupPeripheralClks ()
- HAL_getOscTrimValue ()
- HAL_OscTempComp ()
- HAL_osc1Comp ()
- HAL_osc2Comp ()
- HAL_setupFaults ()
- HAL_setParams()
- HAL_enableDebugInt ()
- HAL_enableGlobalInts ()
- HAL_disableGlobalInts ()
- HAL_disableWdog ()
- 3.4.4 User Settings – user.c, user.h, userParams.h
- 3.4.5 Miscellaneous Functions
- 3.4.1
Controller API Functions – ctrl.c, ctrl.h,
CTRL_obj.h
- 3.5 InstaSPIN-MOTION™ and the SpinTAC™ API
- 3.6 SpinTAC™ API
-
4 User Parameters (user.h)
- 4.1
Currents and Voltages
- 4.1.1 USER_IQ_FULL_SCALE_FREQ_Hz
- 4.1.2 USER_IQ_FULL_SCALE_VOLTAGE_V
- 4.1.3 USER_ADC_FULL_SCALE_VOLTAGE_V
- 4.1.4 USER_VOLTAGE_SF
- 4.1.5 USER_IQ_FULL_SCALE_CURRENT_A
- 4.1.6 USER_ADC_FULL_SCALE_CURRENT_A
- 4.1.7 USER_CURRENT_SF
- 4.1.8 USER_NUM_CURRENT_SENSORS
- 4.1.9 USER_NUM_VOLTAGE_SENSORS
- 4.1.10 I_A_offset , I_B_offset , I_C_offset
- 4.1.11 V_A_offset , V_B_offset , V_C_offset
- 4.2 Clocks and Timers
- 4.3
Decimation
- 4.3.1 USER_NUM_PWM_TICKS_PER_ISR_TICK
- 4.3.2 USER_NUM_ISR_TICKS_PER_CTRL_TICK
- 4.3.3 USER_NUM_CTRL_TICKS_PER_CURRENT_TICK
- 4.3.4 USER_NUM_CTRL_TICKS_PER_EST_TICK
- 4.3.5 USER_NUM_CTRL_TICKS_PER_SPEED_TICK
- 4.3.6 USER_NUM_CTRL_TICKS_PER_TRAJ_TICK
- 4.3.7 USER_CTRL_FREQ_Hz
- 4.3.8 USER_EST_FREQ_Hz
- 4.3.9 USER_TRAJ_FREQ_Hz
- 4.3.10 USER_CTRL_PERIOD_usec
- 4.3.11 USER_CTRL_PERIOD_sec
- 4.4
Limits
- 4.4.1 USER_MAX_NEGATIVE_ID_REF_CURRENT_A
- 4.4.2 USER_ZEROSPEEDLIMIT
- 4.4.3 USER_FORCE_ANGLE_FREQ_Hz
- 4.4.4 USER_MAX_CURRENT_SLOPE_POWERWARP
- 4.4.5 USER_MAX_ACCEL_Hzps
- 4.4.6 USER_MAX_ACCEL_EST_Hzps
- 4.4.7 USER_MAX_CURRENT_SLOPE
- 4.4.8 USER_IDRATED_FRACTION_FOR_RATED_FLUX
- 4.4.9 USER_IDRATED_FRACTION_FOR_L_IDENT
- 4.4.10 USER_IDRATED_DELTA
- 4.4.11 USER_SPEEDMAX_FRACTION_FOR_L_IDENT
- 4.4.12 USER_FLUX_FRACTION
- 4.4.13 USER_POWERWARP_GAIN
- 4.4.14 USER_R_OVER_L_EST_FREQ_Hz
- 4.5 Poles
- 4.6
User Motor and ID Settings
- 4.6.1 USER_MOTOR_TYPE
- 4.6.2 USER_MOTOR_NUM_POLE_PAIRS
- 4.6.3 USER_MOTOR_Rr
- 4.6.4 USER_MOTOR_Rs
- 4.6.5 USER_MOTOR_Ls_d
- 4.6.6 USER_MOTOR_Ls_q
- 4.6.7 USER_MOTOR_RATED_FLUX
- 4.6.8 USER_MOTOR_MAGNETIZING_CURRENT
- 4.6.9 USER_MOTOR_RES_EST_CURRENT
- 4.6.10 USER_MOTOR_IND_EST_CURRENT
- 4.6.11 USER_MOTOR_MAX_CURRENT
- 4.6.12 USER_MOTOR_FLUX_EST_FREQ_Hz
- 4.6.13 USER_MOTOR_ENCODER_LINES (InstaSPIN-MOTION™ Only)
- 4.6.14 USER_MOTOR_MAX_SPEED_KRPM (InstaSPIN-MOTION™ Only)
- 4.6.15 USER_SYSTEM_INERTIA (InstaSPIN-MOTION™ Only)
- 4.6.16 USER_SYSTEM_FRICTION (InstaSPIN-MOTION™ Only)
- 4.6.17 USER_SYSTEM_BANDWIDTH_SCALE (InstaSPIN-MOTION™ Only)
- 4.7
SpinTAC™ Parameters (spintac_velocity.h and
spintac_position.h)
- 4.7.1
Macro Definitions
- 4.7.1.1 ST_MREV_ROLLOVER (spintac_position.h only)
- 4.7.1.2 ST_EREV_MAXIMUM (spintac_position.h only)
- 4.7.1.3 ST_POS_ERROR_MAXIMUM_MREV (spintac_position.h only)
- 4.7.1.4 ST_ISR_TICKS_PER_SPINTAC_TICK
- 4.7.1.5 ST_SPEED_SAMPLE_TIME
- 4.7.1.6 ST_SPEED_PU_PER_KRPM
- 4.7.1.7 ST_SPEED_KRPM_PER_PU
- 4.7.1.8 ST_MOTOR_INERTIA_PU
- 4.7.1.9 ST_MOTOR_FRICTION_PU
- 4.7.1.10 ST_MIN_ID_SPEED_RPM
- 4.7.1.11 ST_MIN_ID_SPEED_PU
- 4.7.1.12 ST_ID_INCOMPLETE_ERROR
- 4.7.1.13 ST_VARS_DEFAULTS
- 4.7.2 Type Definitions
- 4.7.3
Functions
- 4.7.3.1 ST_init
- 4.7.3.2 ST_setupPosConv
- 4.7.3.3 ST_setupVelCtl (Velocity Control Only)
- 4.7.3.4 ST_setupPosCtl (Position Control Only)
- 4.7.3.5 ST_setupVelMove (Velocity Control Only)
- 4.7.3.6 ST_setupPosMove (Position Control Only)
- 4.7.3.7 ST_setupVelPlan (Velocity Control Only)
- 4.7.3.8 ST_setupPosPlan (Position Control Only)
- 4.7.3.9 ST_setupVelId (Velocity Control Only)
- 4.7.3.10 ST_runPosConv
- 4.7.3.11 ST_runVelCtl (Velocity Control Only)
- 4.7.3.12 ST_runPosCtl (Position Control Only)
- 4.7.3.13 ST_runVelMove (Velocity Control Only)
- 4.7.3.14 ST_runPosMove (Position Control Only)
- 4.7.3.15 ST_runVelPlan (Velocity Control Only)
- 4.7.3.16 ST_runVelPlanTick (Velocity Control Only)
- 4.7.3.17 ST_runPosPlan (Position Control Only)
- 4.7.3.18 ST_runPosPlanTick (Position Control Only)
- 4.7.3.19 ST_runVelId (Velocity Control Only)
- 4.7.1
Macro Definitions
- 4.8 Setting ACIM Motor Parameters in user.h
- 4.1
Currents and Voltages
- 5 Managing Motor Signals
-
6 Motor Identification and State Diagrams
- 6.1 Overview
- 6.2 InstaSPIN™ Motor Identification
- 6.3 Motor Identification Process Overview
- 6.4 Differences between PMSM and ACIM Identification Process
- 6.5 Prerequisites
- 6.6
Full Identification of PMSM Motors
- 6.6.1 CTRL_State_Idle and EST_State_Idle
- 6.6.2 CTRL_State_OffLine and EST_State_Idle (Hardware Offsets Calibrated)
- 6.6.3 CTRL_State_OnLine and EST_State_RoverL
- 6.6.4 CTRL_State_OnLine and EST_State_Rs
- 6.6.5 CTRL_State_OnLine and EST_State_RampUp
- 6.6.6 CTRL_State_OnLine and EST_State_RatedFlux
- 6.6.7 CTRL_State_OnLine and EST_State_Ls
- 6.6.8 CTRL_State_OnLine and EST_State_RampDown
- 6.6.9 CTRL_State_OnLine and EST_State_MotorIdentified
- 6.6.10 CTRL_State_Idle and EST_State_Idle
- 6.7
Full Identification of ACIM Motors
- 6.7.1 CTRL_State_Idle and EST_State_Idle
- 6.7.2 CTRL_State_OffLine and EST_State_Idle
- 6.7.3 CTRL_State_OnLine and EST_State_RoverL
- 6.7.4 CTRL_State_OnLine and EST_State_Rs
- 6.7.5 CTRL_State_OnLine and EST_State_RampUp
- 6.7.6 CTRL_State_OnLine and EST_State_IdRated
- 6.7.7 CTRL_State_OnLine and EST_State_RatedFlux
- 6.7.8 CTRL_State_OnLine and EST_State_RampDown
- 6.7.9 CTRL_State_Idle and EST_State_LockRotor
- 6.7.10 CTRL_State_OnLine and EST_State_Ls
- 6.7.11 CTRL_State_OnLine and EST_State_Rr
- 6.7.12 CTRL_State_OnLine and EST_State_RampDown
- 6.7.13 CTRL_State_OnLine and EST_State_MotorIdentified
- 6.7.14 CTRL_State_Idle and EST_State_Idle
- 6.8
Recalibration of PMSM and ACIM Motor Identification
- 6.8.1 Recalibration of PMSM and ACIM Motors After Full Identification
- 6.8.2 Recalibration of PMSM and ACIM Motors after Using Parameters from user.h
- 6.9 Setting PMSM Motor Parameters in user.h
- 6.10
Troubleshooting Motor Identification
- 6.10.1
Troubleshooting PMSM Motor Identification
- 6.10.1.1 Identifying PMSM Motors When Load Cannot be Detached
- 6.10.1.2 Can Motor Rotate with the Attached Load?
- 6.10.1.3 Run First Three Steps of Identification
- 6.10.1.4 Run Using Motor Parameters from user.h
- 6.10.1.5 Troubleshooting Motor Shaft Stopping During Ramp-Up
- 6.10.1.6 Troubleshooting Motor Shaft for Smoother Ramp
- 6.10.1.7 Troubleshooting Flux Measurement
- 6.10.1.8 Troubleshooting Ls Identification
- 6.10.1.9 Identifying High-Cogging Torque PMSM Motors
- 6.10.2 Troubleshooting ACIM Motor Identification
- 6.10.1
Troubleshooting PMSM Motor Identification
- 7 Inertia Identification
-
8 MCU Considerations
- 8.1 Overview
- 8.2 InstaSPIN-Enabled Devices
- 8.3 ROM and User Memory Overview
- 8.4 Details on CPU Load and Memory Footprint Measurements
- 8.5 Memory Footprint
- 8.6 CPU Load
- 8.7 Digital and Analog Pins
- 9 Real-Time Structure
- 10Managing Startup Time
-
11Tuning Regulators
- 11.1 PI Controllers Introduction
- 11.2 PI Design for Current Controllers
- 11.3 PI Design for Speed Controllers
- 11.4 Calculating PI Gains Based On Stability and Bandwidth
- 11.5 Calculating Speed and Current PI Gains Based on Damping Factor
- 11.6 Considerations When Adding Poles to the Speed Loop
- 11.7 Speed PI Controller Considerations: Current Limits, Clamping and Inertia
- 11.8 Considerations When Designing PI Controllers for FOC Systems
- 11.9 Sampling and Digital Systems Considerations
-
12InstaSPIN-MOTION™ Controllers
- 12.1 Overview
- 12.2 Stability
- 12.3 Software Configuration for the SpinTAC™ Velocity Control
- 12.4 Optimal Performance in Speed Control
- 12.5 Software Configuration for SpinTAC™ Position Control
- 12.6 Optimal Performance in Position Control
-
13Trajectory Planning
- 13.1 InstaSPIN-MOTION™ Profile Generation
- 13.2 Software Configuration for SpinTAC™ Velocity Move
- 13.3 Software Configuration for SpinTAC™ Position Move
- 13.4
InstaSPIN-MOTION™ Sequence Planning
- 13.4.1 SpinTAC™ Velocity Plan Elements
- 13.4.2 SpinTAC™ Velocity Plan Element Limits
- 13.4.3 SpinTAC™ Velocity Plan Example: Washing Machine Agitation
- 13.4.4 SpinTAC™ Velocity Plan Example: Garage Door
- 13.4.5 SpinTAC™ Velocity Plan Example: Washing Machine
- 13.4.6 SpinTAC™ Position Plan Example: Vending Machine
- 13.5
Software Configuration for SpinTAC™ Velocity Plan
- 13.5.1 Include the Header File
- 13.5.2 Define the Size of the Configuration Array
- 13.5.3 Declare the Global Structure
- 13.5.4 Initialize the Configuration Variables
- 13.5.5 Call SpinTAC™ Velocity Plan
- 13.5.6 Call SpinTAC™ Velocity Plan Tick
- 13.5.7 Update SpinTAC™ Velocity Plan with SpinTAC™ Velocity Move Status
- 13.6 Troubleshooting SpinTAC™ Velocity Plan
- 13.7
Software Configuration for SpinTAC™ Position Plan
- 13.7.1 Include the Header File
- 13.7.2 Define the Size of the Configuration Array
- 13.7.3 Declare the Global Structure
- 13.7.4 Initialize the Configuration Variables
- 13.7.5 Call SpinTAC™ Position Plan
- 13.7.6 Call SpinTAC™ Position Plan Tick
- 13.7.7 Update SpinTAC™ Position Plan with SpinTAC™ Position Move Status
- 13.8 Troubleshooting SpinTAC™ Position Plan
- 13.9 Conclusion
-
14Managing Full Load at Startup, Low-Speed, and Speed
Reversal
- 14.1 Overview
- 14.2 Low-Speed Operation with Full Load
- 14.3 Speed Reversal with Full Load
- 14.4 Motor Startup with Full Load
- 14.5 Rapid Acceleration from Standstill With Full Load
- 14.6 Overloading and Motor Overheating
- 14.7 InstaSPIN-MOTION™ and Low-Speed Considerations
-
15Rs Online Recalibration
- 15.1 Overview
- 15.2 Resistance vs. Temperature
- 15.3 Accurate Rs Knowledge Needed at Low Speeds Including Startup
- 15.4 Introduction to Rs Online Recalibration
- 15.5 Rs Online vs. Rs Offline
- 15.6 Enabling Rs Online Recalibration
- 15.7 Disabling Rs Online Recalibration
- 15.8 Modifying Rs Online Parameters
- 15.9 Monitoring Rs Online Resistance Value
- 15.10 Using the Rs Online Feature as a Temperature Sensor
- 15.11 Rs Online Related State Diagrams (CTRL and EST)
- 16PowerWarp™
- 17Shunt Current Measurements
- 18Sensored Systems
14.2.2.2 2-Hz, No-Load to Full-Load Transient
Figure 15-11 shows the current waveform under these conditions:
- Dynamometer = 1.9 N·m (full load)
- Speed Controller = 2 Hz (30 RPM ± 3 RPM)
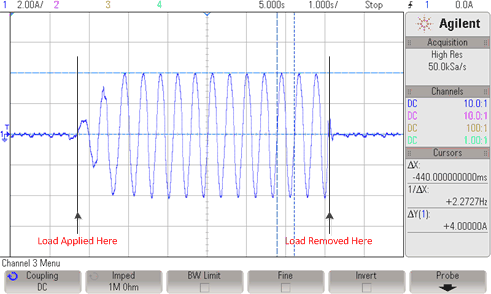 Figure 14-11 2-Hz, No-Load to Full-Load Transient Plot
A torque transient of the motor's rated torque of 1.9 N·m is applied to the motor shaft, resulting in a current of 4 A. The electrical frequency as seen in the oscilloscope plot is 2.2 Hz, which is about 3 RPM higher than commanded by the speed reference. For a 4-pole pair motor, this frequency results in a speed of 30 ± 3 RPM once it has stabilized.
The challenge we run into when using hysteresis dynamometers is that the torque production and the detent torque present in the dynamometer shaft produce an instantaneous torque higher than the commanded torque, causing the motor to be stalled from time to time. This is the main reason why we increased the torque command of the dynamometer at a lower rate compared to the previous example, to avoid the dynamometer to produce more torque than commanded when the motor is stalled temporarily.
Figure 15-12, Figure 15-13, Figure 15-14, and Figure 15-15 show the behavior of the FAST algorithm. FAST stands for Flux, Angle, Speed and Torque, and this is how the torque step command affects those variables. The first variable is the flux linkage of the motor.
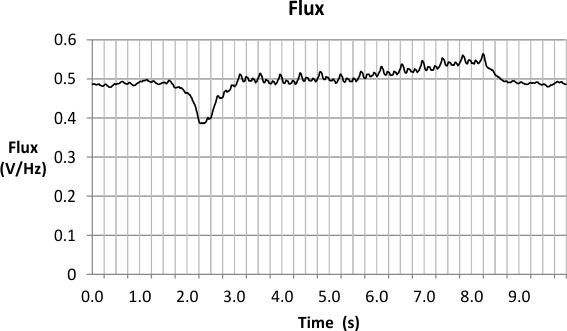 Figure 14-12 Flux Plot
Figure 15-13, Figure 15-14, and Figure 15-15 show the flux angle provided by FAST. As was seen with the previous test, the angle is tracked through the increase of motor load, and also the decrease of motor load.
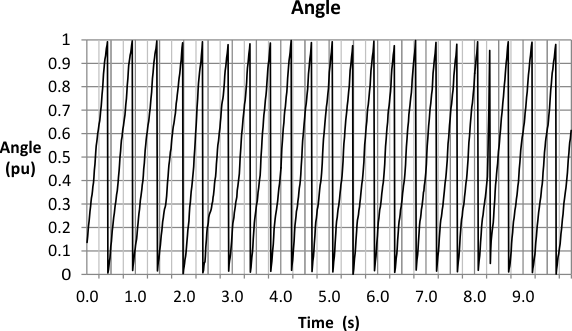 Figure 14-13 Angle Plot
Zooming in the angle plot, we can see transients when the motor is being loaded, and when the load is removed. As we get lower in speed, the quality of the signals, combined with the torque pulsations of the hysteresis dynamometer, makes the angle not look like a perfect saw tooth. Even then, the angle information provides good enough information to run a full FOC control at 2 Hz and a full load transient.
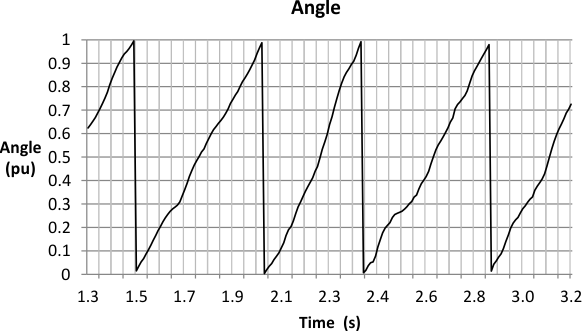 Figure 14-14 Zoom-in on Angle Plot - Increased Motor Load
Zooming in when the load is removed from the shaft, we can see an instantaneous angle tracking.
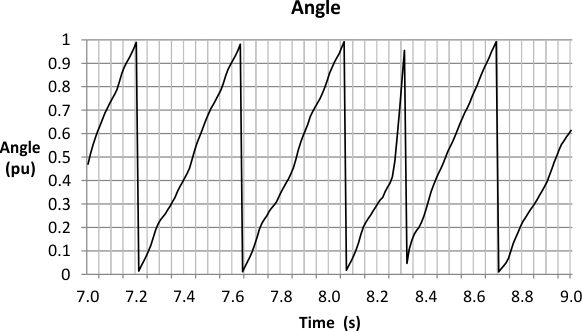 Figure 14-15 Zoom-in on Angle Plot - Decreased Motor Load
The speed plot is shown in Figure 15-16. The target speed is 30 RPM, and we can see higher ripple on the estimated speed compared to 60 RPM. This is due to the pulsating torque present in the hysteresis dynamometer and also, the estimated speed output is instantaneous as opposed to every electrical cycle. So any distortion on the angle ramp will be reflected in a speed oscillation.
FAST variables consistently enable FOC system to apply full torque even with a 100% step-load at low speeds.
Also, when the load is completely removed, which is done by turning off the dynamometer controller, the speed estimation follows the real speed even when there is rapid acceleration, as shown in Figure 15-11.
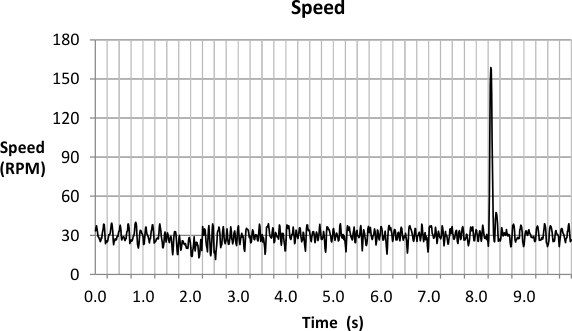 Figure 14-16 Speed Plot
The torque signal is shown in Figure 15-17. Oscillations are due to the low frequency of the estimator, as well as the torque pulsations present in the hysteresis dynamometer at low speeds.
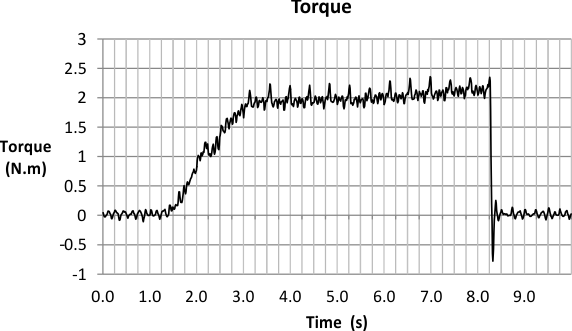 Figure 14-17 Torque Plot
The current controller follows the curve of the commanded torque as can be seen in Figure 15-18, taking the current to the rated 4 A in Iq.
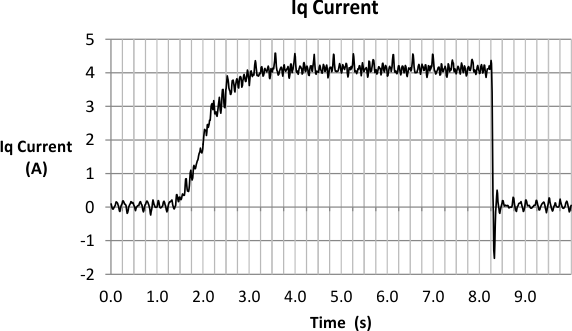 Figure 14-18 Iq Current Plot