TIDT279 October 2022
2.4 Conducted Emissions vs CISPR Class 5
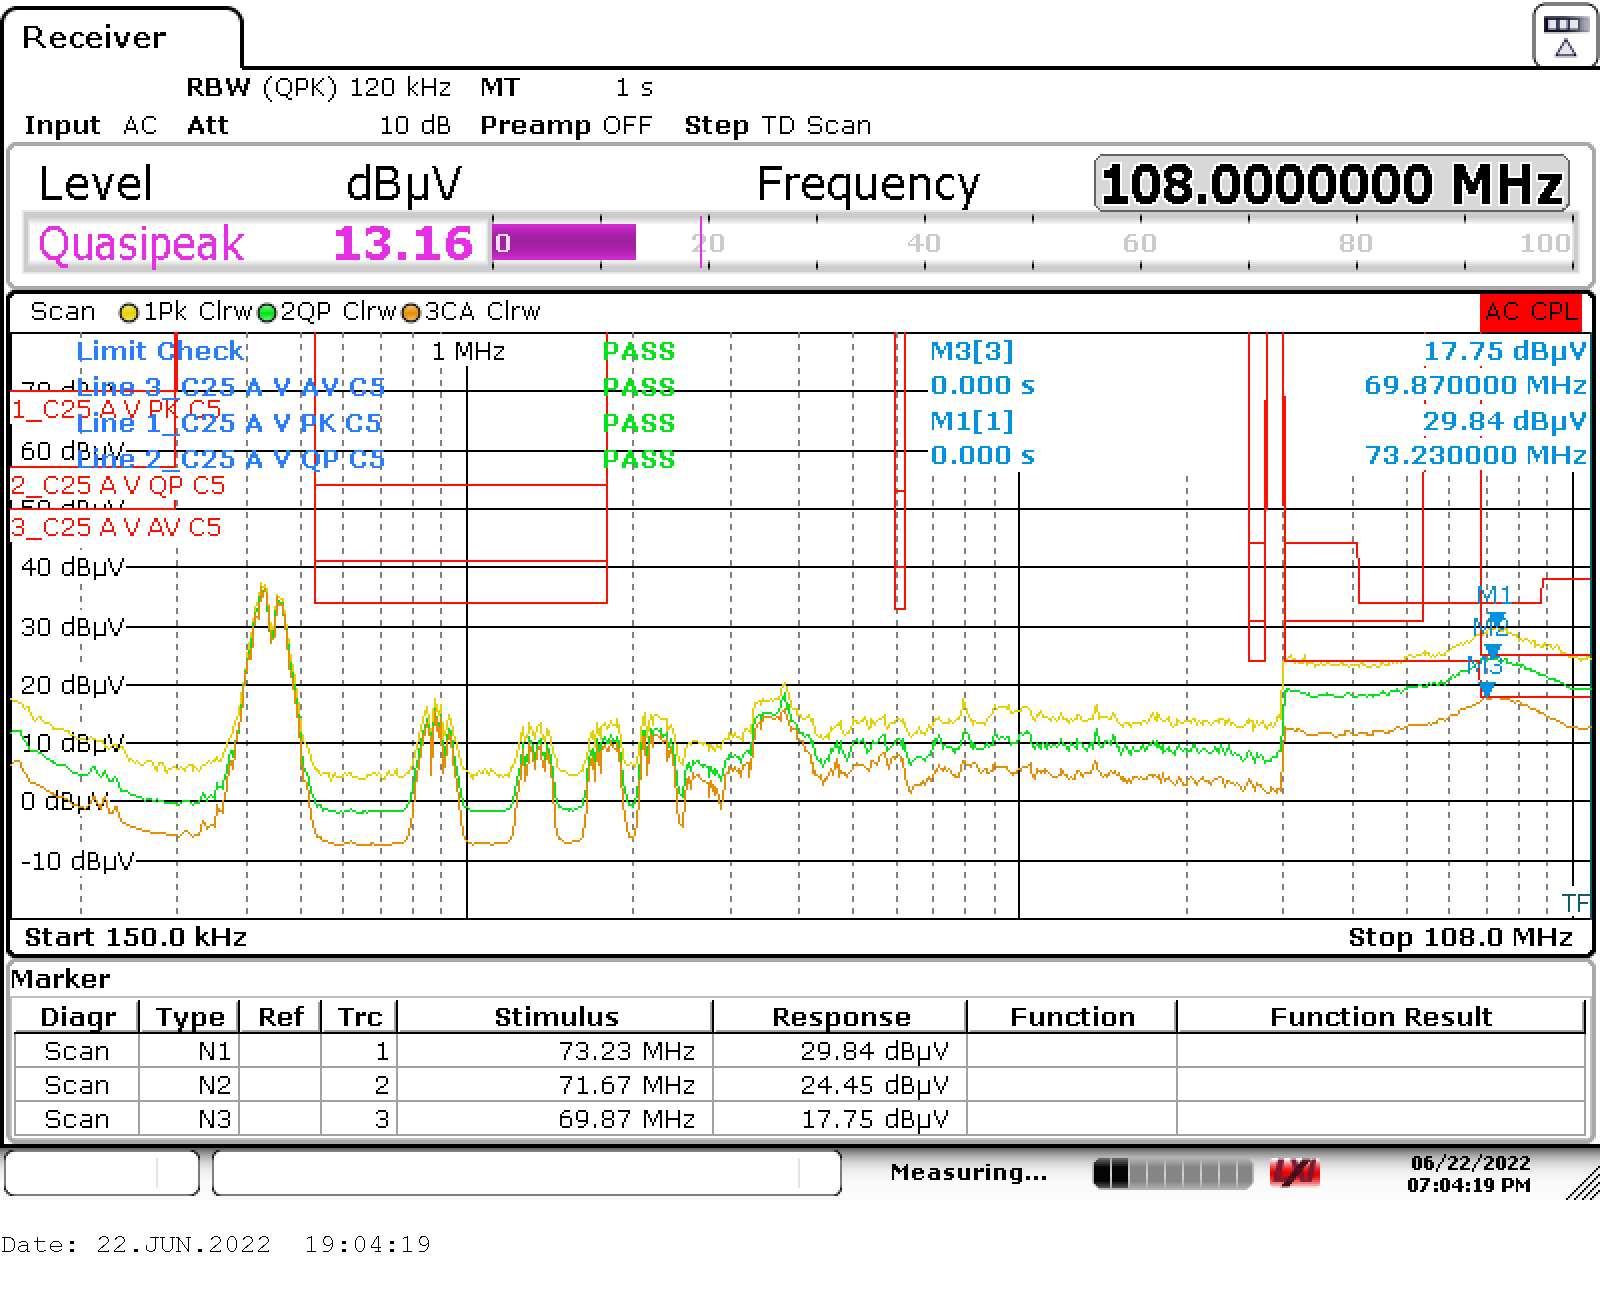
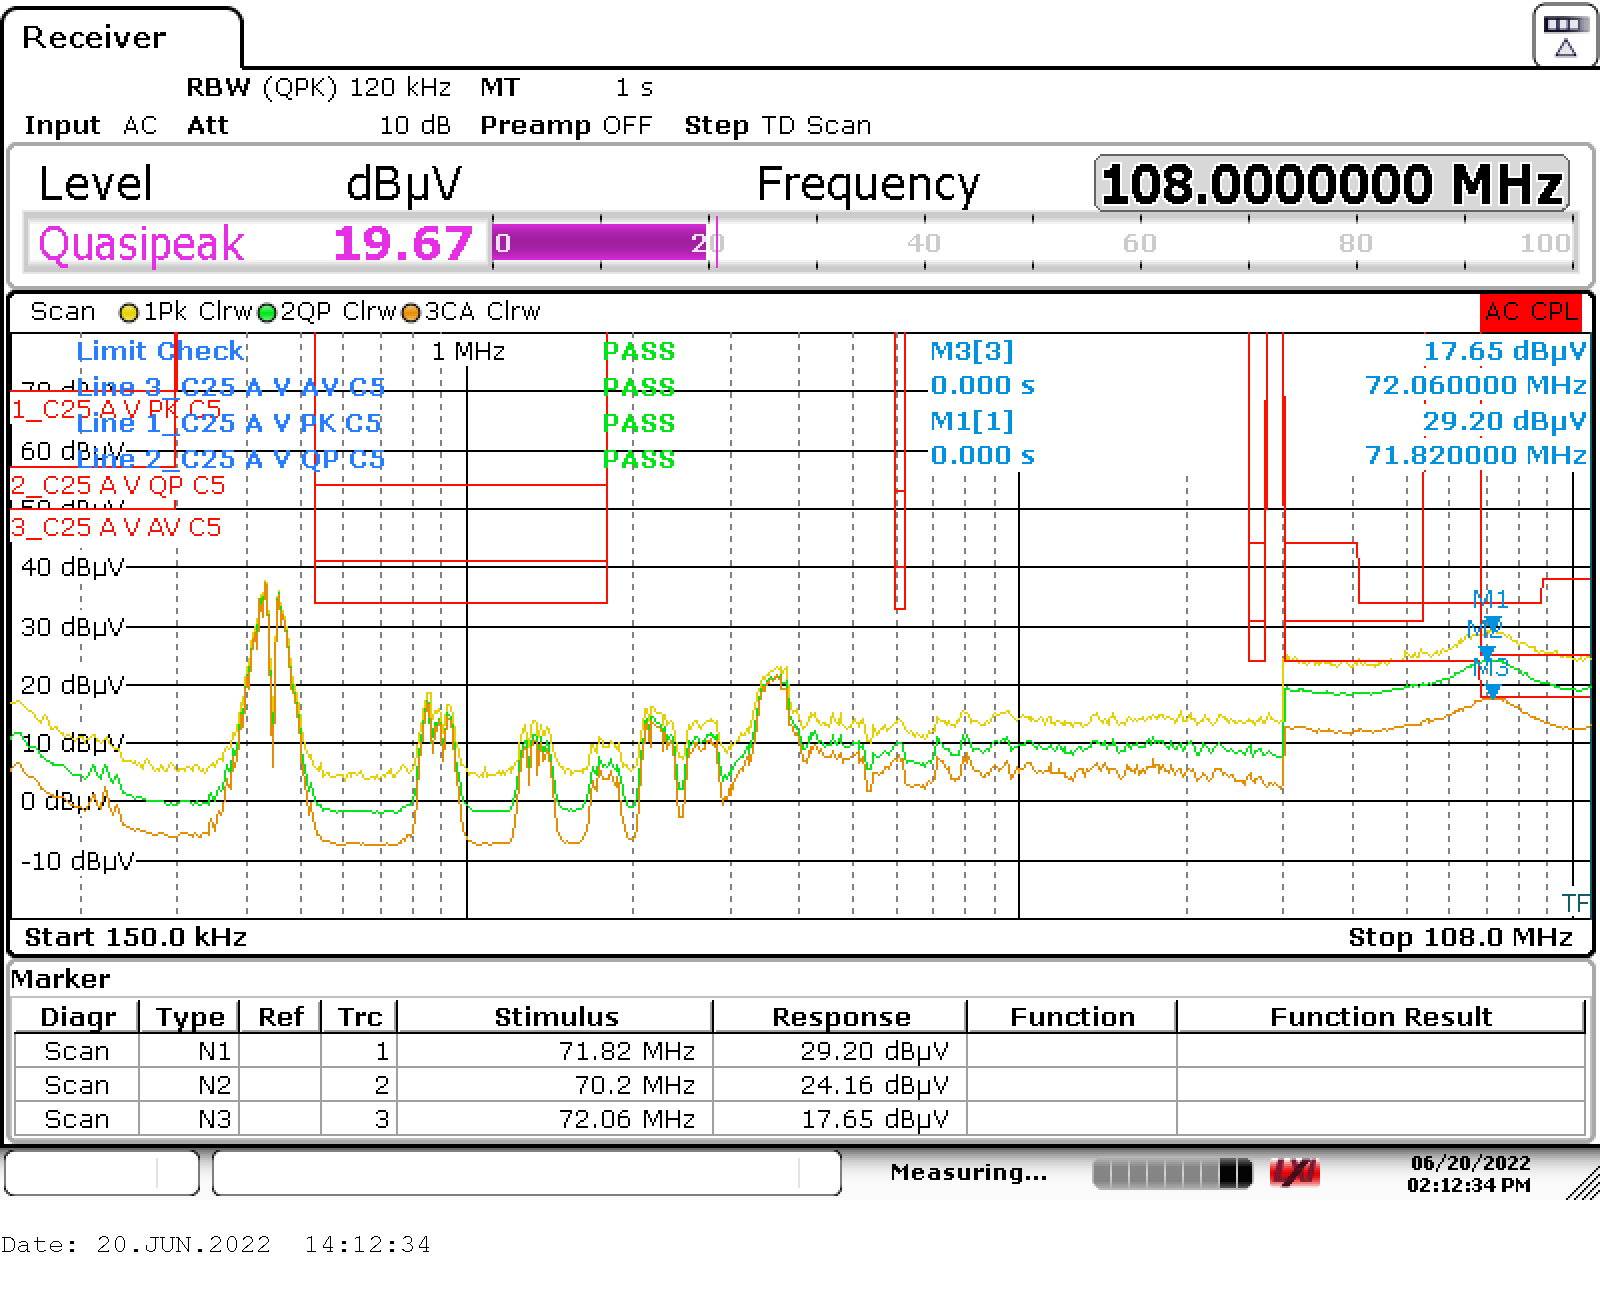
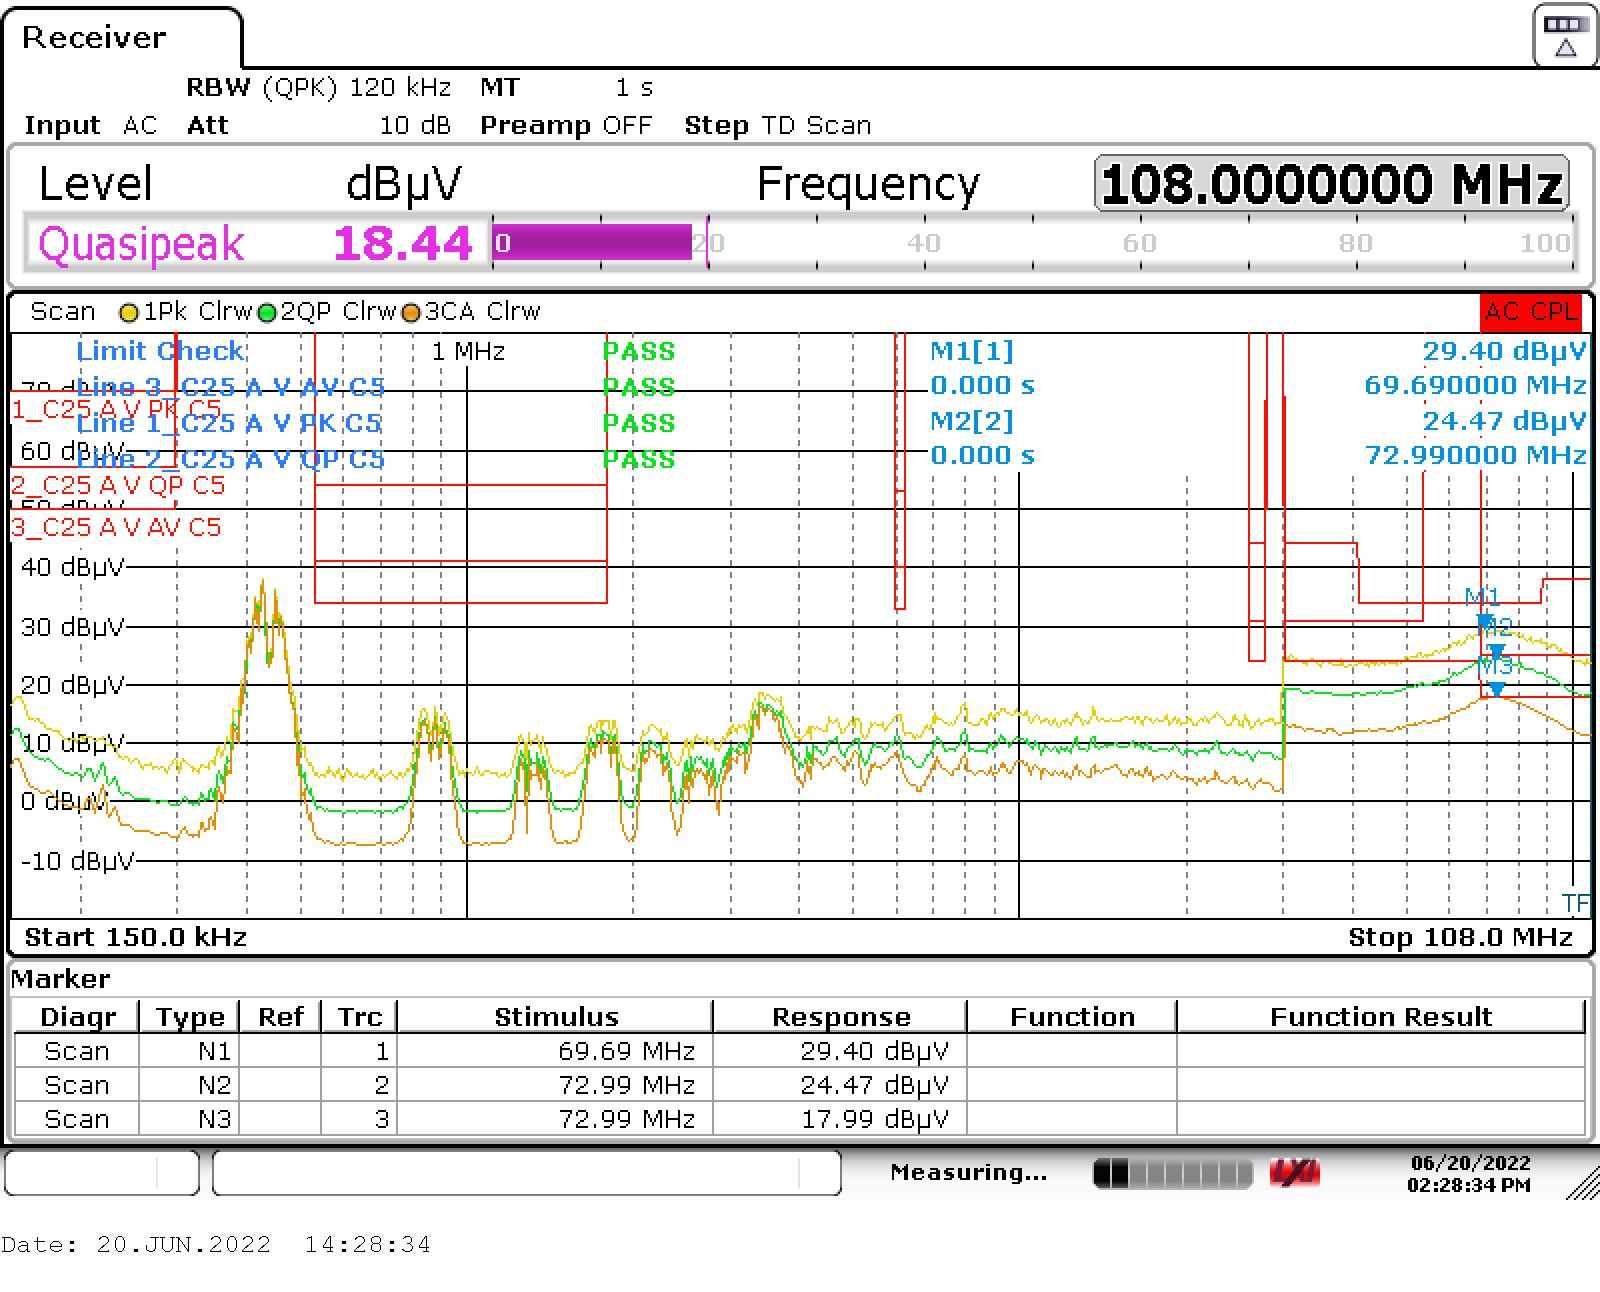
See the test setup for conducted emissions in Figure 1-1. Conducted EMI scans over the full 150-kHz to 108-MHz range are shown in the following figures. All three PMP23194 models were tested with near maximum loading on all three outputs. Each scan shows the maximum peak detection trace, quasi-peak detection trace, and CISPR average detection trace. Limit lines shown are for CISPR 25 Class 5 peak, quasi-peak and average limits. Worst cases were around 70 MHz for both quasi-peak and average with less than 1-dB margin, and for maximum peak with 4- to 5-dB margin. All three models scanned show passing Class 5 and very similar results. The worst-case average and quasi-peak results varied less than 0.5 dB. The following scans are models t1, t2, and t3 respectively.
 Figure 2-14 Model t1 Conducted Emissions
 Figure 2-15 Model t2 Conducted Emissions
 Figure 2-16 Model t3 Conducted Emissions