TIDUE90 July 2018
- Description
- Resources
- Features
- Applications
- Design Images
- 1System Description
- 2System Overview
- 3Hardware, Software, Test Requirements, and Test Results
- 4Design Files
- 5Software Files
- 6Related Documentation
- 7About the Author
3.2.1.1 Continuous Water Flow Test
Test Setup
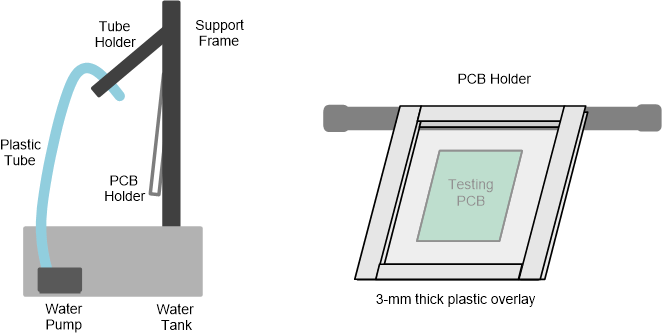
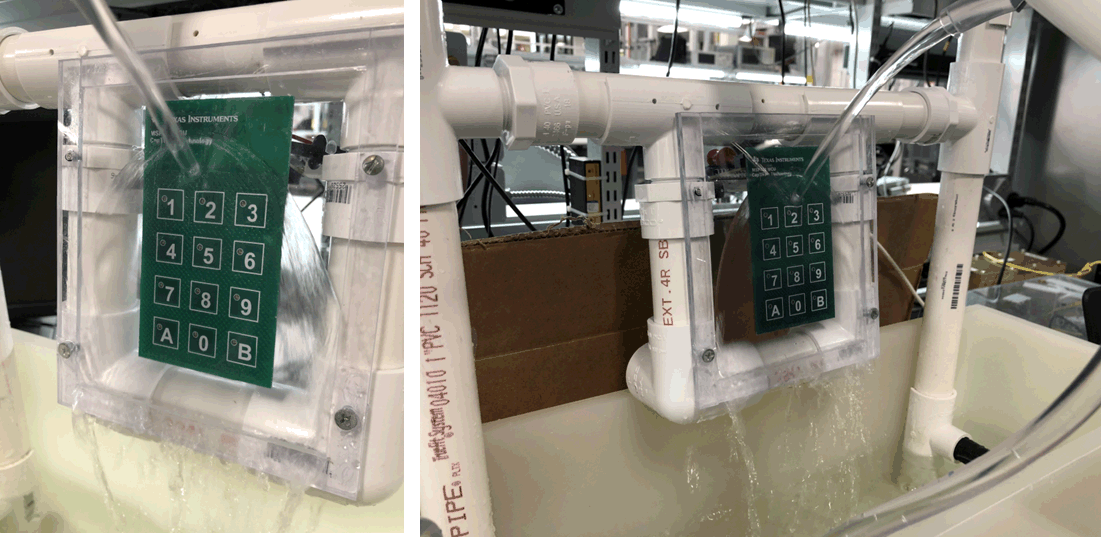
Figure 16 shows a tank filled with water and a 12-V pump to provide the continuous water flow for this test. The TIDM-1021 PCB is attached on the back of a 3-mm-thick plastic overlay with 467MP double-sided adhesive. The overlay is mounted on a PCB holder to hold the test unit on a support frame. This setup allows a continuous water flow directly on the touch sensor area. Figure 17 shows a photograph of the test setup. The water used in all the liquid test cases is tap water from the local piped supply.
 Figure 16. Liquid Test Setup
  Figure 17. Continuous Water Flow Test Setup
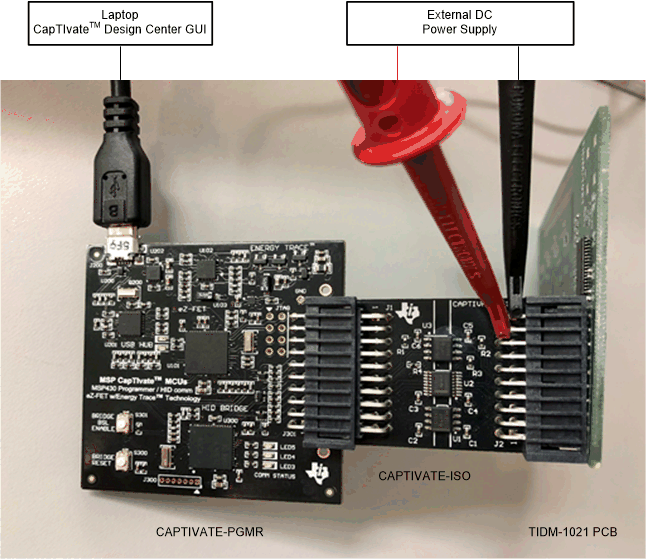
 The TIDM-1021 PCB is connected to the CapTIvate communications isolation board (CAPTIVATE-ISO) and the MSP430 CapTIvate MCU programmer board (CAPTIVATE-PGMR) (see Figure 18). This setup collects the data with a laptop through the USB cable and provides the 3.3-V power to the system using an external DC power supply.
 Figure 18. Test Hardware Setup
 Test Procedures
- A user touches each button from Button 1 to Button B.
- Turn on the water pump with continuous water flow.
- A user touches each button from Button 1 to Button B.
- Turn off the water pump.
Test Result
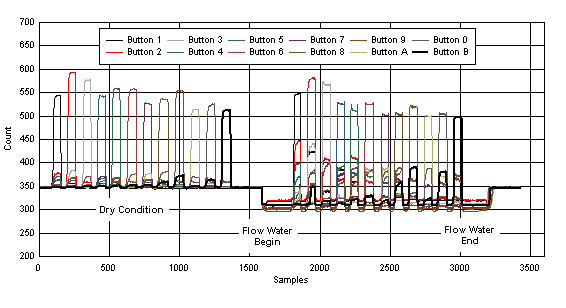
Figure 19 shows the sensor measurement count result for this test. The Y axis represents the sensor measurement count, and the X axis represents the number of samples. Each color represents the data for a specific button. The data shows that the sensor is calibrated at a baseline count of 350, and the touch increases the count to approximately 550 in dry conditions. When the flowing water is applied on the touch sensor area, the data shows the "negative touch" behavior (see Section 2.2.3.2). The flowing water causes the measurement result to go in the opposite direction of a touch event, so no false touch is detected. While the water is continuously flowing on the touch sensor area, each touch event can still cause a distinguishable count increase for the touched button. Based on this test result and by using the software algorithm in Section 3.1.2, the system can reliably operate when exposed to continuous water flow, with no false touch detections and with accurate detection of a button touch.
 Figure 19. Sensor Count Result With Continuous Water Flow (Well Grounded Power Supply)