SBAU382A November 2021 – January 2022 ADS7029-Q1 , ADS7039-Q1 , ADS7040 , ADS7041 , ADS7042 , ADS7043 , ADS7044 , ADS7046 , ADS7047 , ADS7049-Q1 , ADS7052 , ADS7054 , ADS7056 , ADS7057
4.3 Time Domain Display
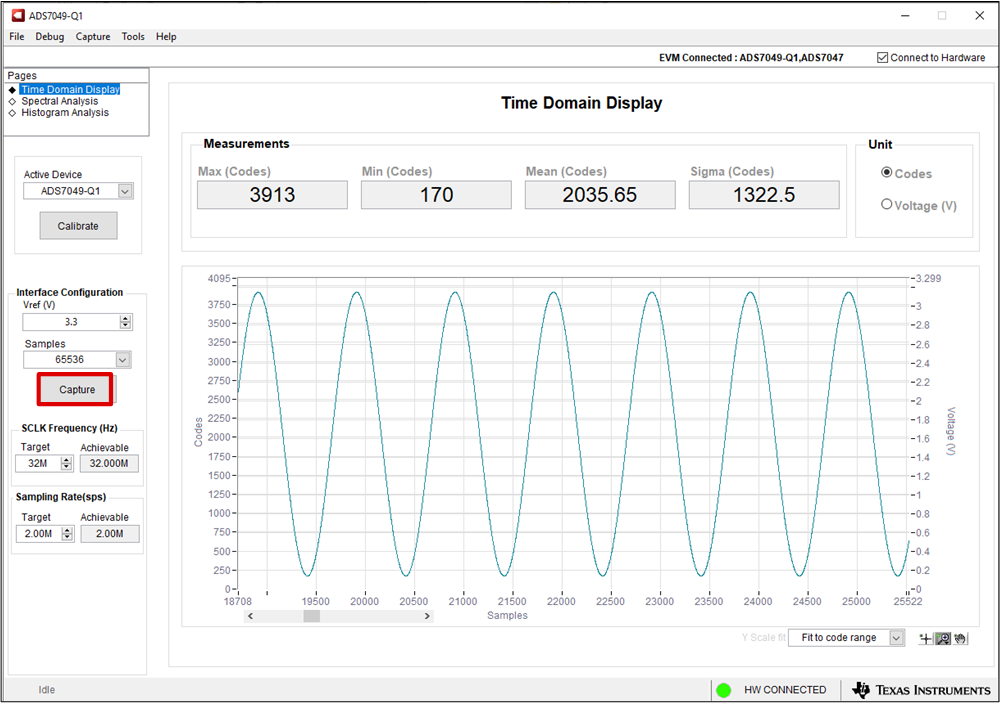
The Time Domain Display tool visualizes the ADC response to a given input signal. This tool is useful for both studying the behavior of and debugging any gross problems with the ADC or drive circuits, such as waveform clipping.
Trigger a data capture of the selected number of samples by using the Capture button highlighted in Figure 4-3. The GUI plots a waveform based on the input signal. The waveform is plotted by Samples on the x-axis against Codes and Voltage on the left and right y-axes, respectively. Voltage is relative to the specified reference voltage, which for all devices in Table 1-2 is just the AVDD voltage. Switching Pages to any of the analysis tools described in the subsequent sections causes calculations to be performed on the same set of data.
 Figure 4-3 Time Domain Display in the
ADS704X-5XEVM GUI