SLAAEF5 March 2024 MSPM0G1505 , MSPM0G1505 , MSPM0G1506 , MSPM0G1506 , MSPM0G1507 , MSPM0G1507 , MSPM0L1303 , MSPM0L1303 , MSPM0L1304 , MSPM0L1304 , MSPM0L1304-Q1 , MSPM0L1304-Q1 , MSPM0L1305 , MSPM0L1305 , MSPM0L1305-Q1 , MSPM0L1305-Q1 , MSPM0L1306 , MSPM0L1306 , MSPM0L1306-Q1 , MSPM0L1306-Q1
- 1
- Abstract
- Trademarks
- 1Introduction
- 2Algorithm Introduction
- 3Gauge GUI Introduction
- 4MSPM0 Gauge Evaluation Steps
- 5MSPM0 Gauge Solutions
- 6References
4.2.2 Battery Model Generation
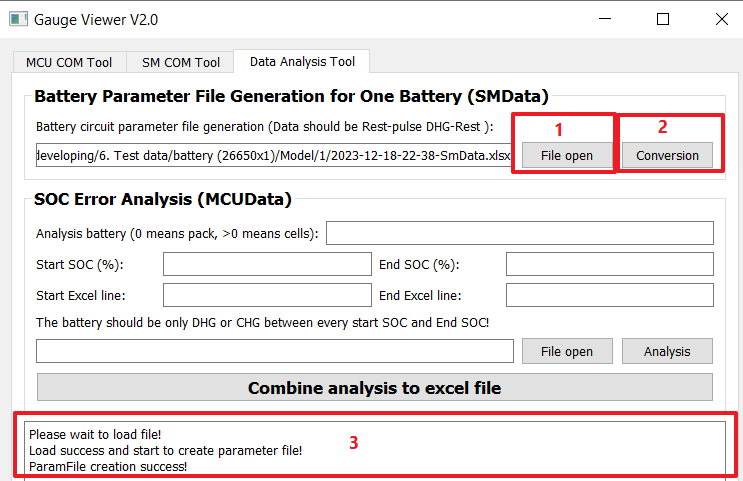
After you get the battery running data in SMData format or the MCUData format (the name should also flow their naming format), you can then use “Battery Parameter File Generation for One Battery” to get the battery model (battery circuit file) in excel and text, by following in the steps in Figure 4-4.
 Figure 4-4 Generate Parameter File From
SMData
Figure 4-4 Generate Parameter File From
SMDataCopy the generated table in the text into Gauge_UserConfig.c, and the table length into Gauge_UserConfig.h. Then, you can finish the battery circuit table input.
 Figure 4-5 Battery Circuit Table
Input
Figure 4-5 Battery Circuit Table
InputThe element of the battery circuit table (Battery model) has five combinations:
- The first is OCV (mV).
- The second is SOC.
- The third is Rcell (Ω).
- The fourth is cap factor.
- The fifth is slope rate.
For OCV and SOC, it influences the SOC calibration used in the Capacity learn part. For Rcell and cap factor, it will mostly influence the VFAbsSoc accuracy.
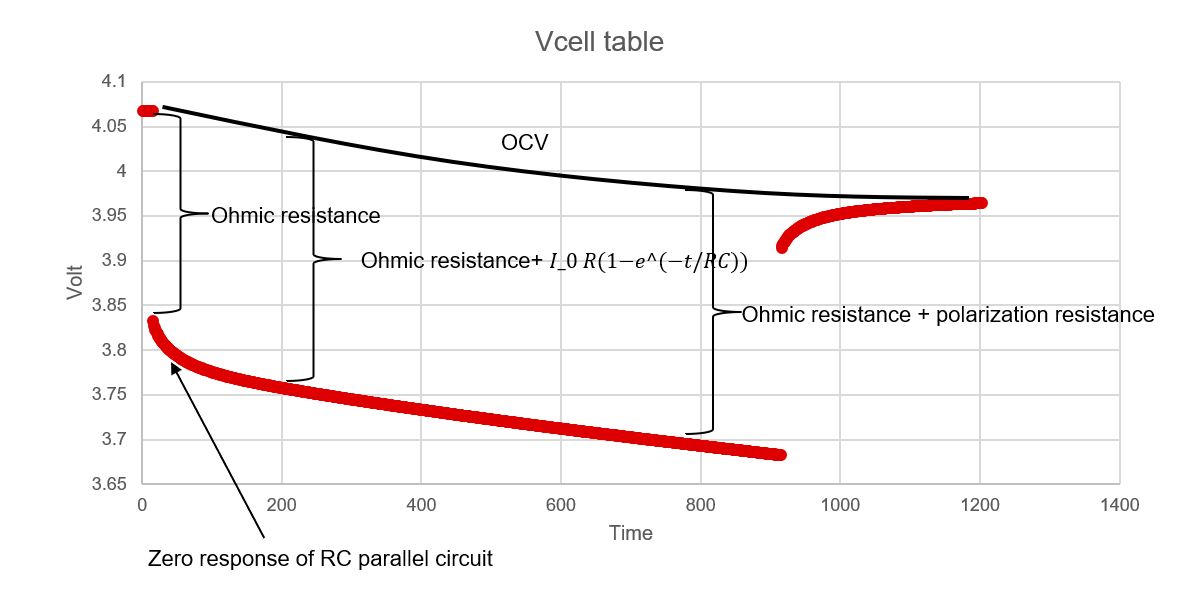
A brief introduction is given on how these parameters are generated. As shown in Figure 4-6, OCV equals to the final Vcell before discharging. SOC is obtained after the test with the Qmax at the same time, using Equation 2. Rcell equals to the Ohmic resistance shown in Figure 4-6. The voltage change in one second is treated as the influence of Rcell and its value equals to dOcv(mV)/Current(mA). The cap factor equals to dSOC(%)/dOCV(mV)*Qmax(As) or dSOC(%)/dOCV(V)*3.6*Qmax(mAh). Slope rate equal to dSOC(Dec) / dOCV(mV). For the detailed parameters generation method, see the python source code shared in the development package of this document.
 Figure 4-6 Pulse Discharge
Example
Figure 4-6 Pulse Discharge
ExampleFor high-level MSPM0 Gauge solution, as it takes the residual SOC or battery aging into consideration, it is good to make the circuit table larger than the application voltage range to reserve some buffer. Table 4-2 shows an example for different discharge conditions. Pay attention to the difference between OCV and max charge/discharge voltage.
| Current<0.01C | Current<0.1C | Current<0.5C | |
|---|---|---|---|
| Table max OCV | 4.3V | 4.3V | 4.3V |
| Table min OCV | 2.6V | 2.6V | 2.6V |
| Application max charge voltage | 4.2V | 4.2V | 4.2V |
| Application min discharge voltage | 2.8V | 2.8V | 2.8V |