SLAAEF5 March 2024 MSPM0G1505 , MSPM0G1505 , MSPM0G1506 , MSPM0G1506 , MSPM0G1507 , MSPM0G1507 , MSPM0L1303 , MSPM0L1303 , MSPM0L1304 , MSPM0L1304 , MSPM0L1304-Q1 , MSPM0L1304-Q1 , MSPM0L1305 , MSPM0L1305 , MSPM0L1305-Q1 , MSPM0L1305-Q1 , MSPM0L1306 , MSPM0L1306 , MSPM0L1306-Q1 , MSPM0L1306-Q1
- 1
- Abstract
- Trademarks
- 1Introduction
- 2Algorithm Introduction
- 3Gauge GUI Introduction
- 4MSPM0 Gauge Evaluation Steps
- 5MSPM0 Gauge Solutions
- 6References
3.3 Data Analysis Tool
Data Analysis Tool is used to do some data conversion and data analysis work.
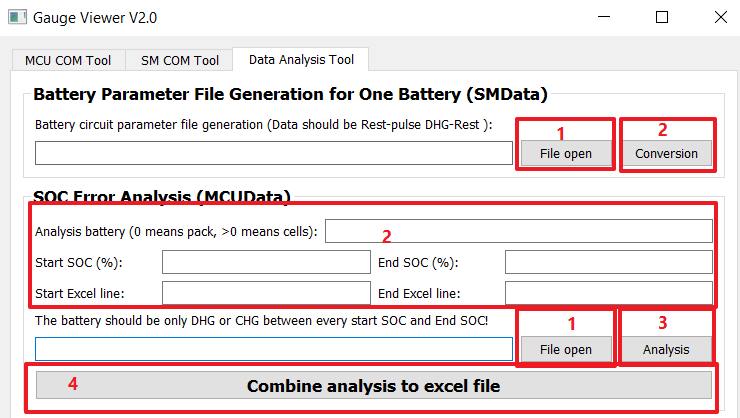
The first function is the battery parameter file generation, shown in Figure 3-3. It is used to abstract battery circuit information from the pulse discharge datas (SMData file). Follow the steps, you will get the battery parameter file, for details, see Section 4.2.1.
The second function is to analyze the Gauge accuracy performance. After a real test, MCUData file is generated. The SOC outputted by Gauge at the start of the Excel line and end of the Excel line are priori values. The input of the Start SOC and End SOC by you are posterior values. After you press the analysis button, it first calculates the Qmax by the Start SOC and End SOC input and then generates posterior for every excel line. In a test pastern, there may be more than one DHG and CHG. That means you will also need to do the input in step 2 and step 3 for the same times. At last, you can click step 4, then the GUI will output the final result.
 Figure 3-3 Data Analysis Tool