SLUUCQ0A may 2023 – june 2023 TPS922052 , TPS922053 , TPS922054 , TPS922055
5.5 PWM Dimming Performance
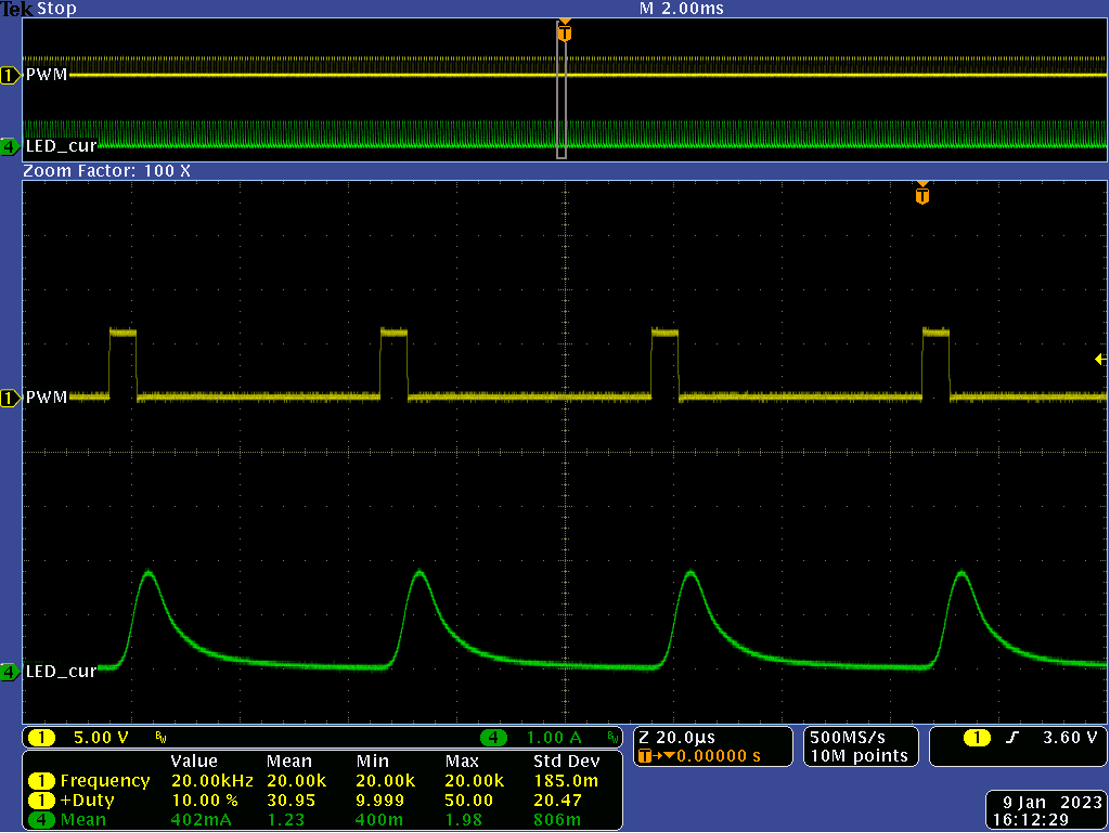
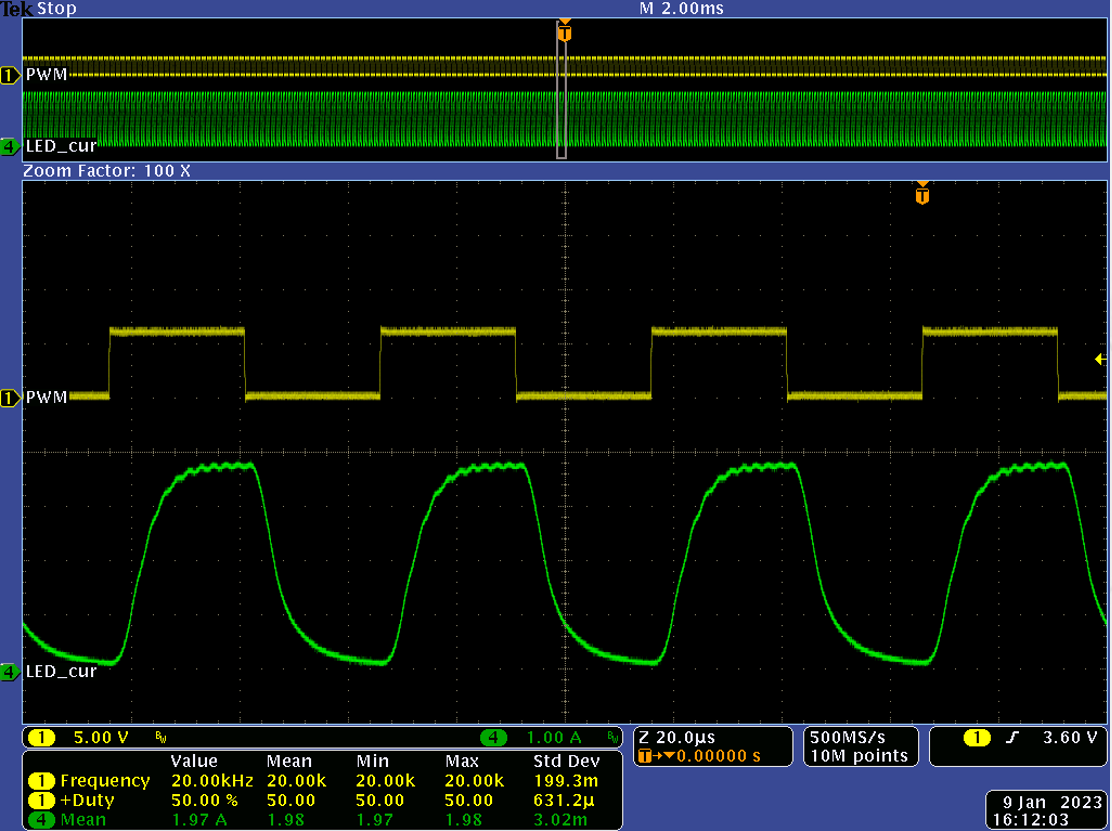
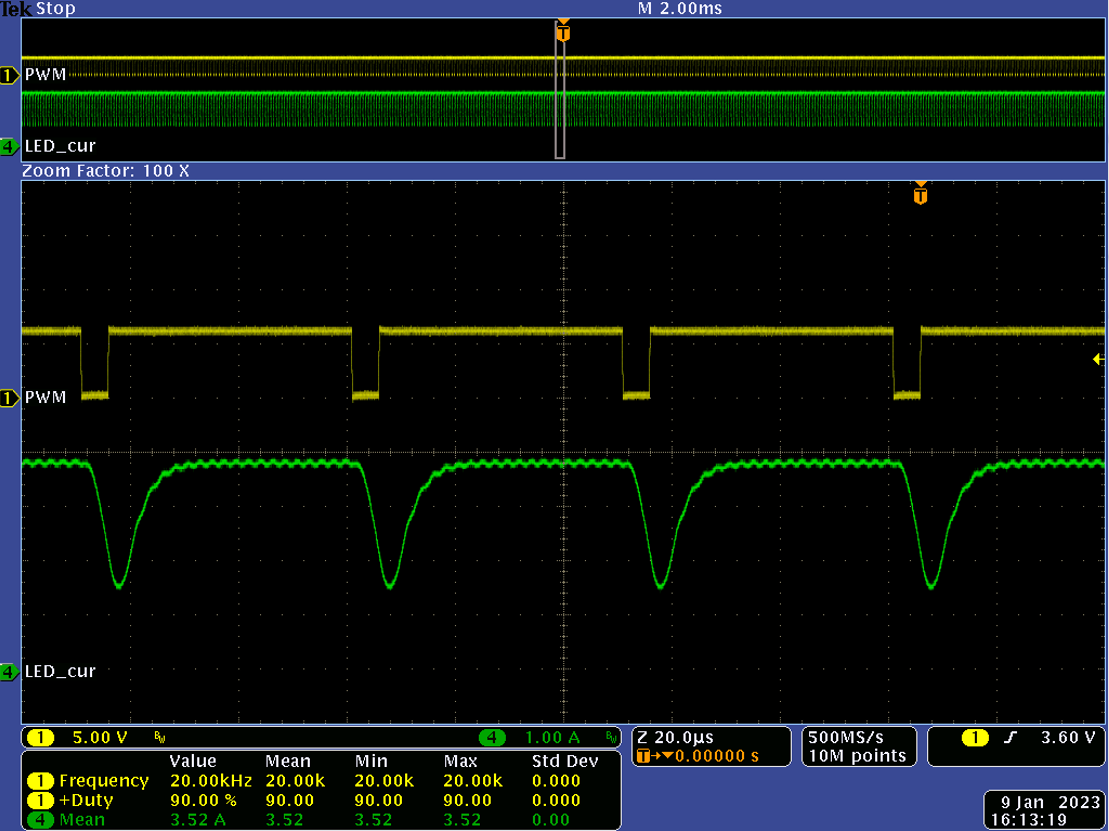
Figure 5-14, Figure 5-15, and Figure 5-16 show the PWM dimming waveforms at 10%, 50%, and 90% duty cycles, respectively. Input voltage is 48 V, with 7 white LEDs in series used as load. The full-scale LED current is set at 4.0 A. The frequency of the input PWM signal at the PWM/EN pin is 20 kHz.
 Figure 5-7 Waveforms at 10% Duty Cycle, 20 kHz PWM Dimming
 Figure 5-8 Waveforms at 50% Duty Cycle, 20 kHz PWM Dimming
 Figure 5-9 Waveforms at 90% Duty Cycle, 20 kHz PWM Dimming
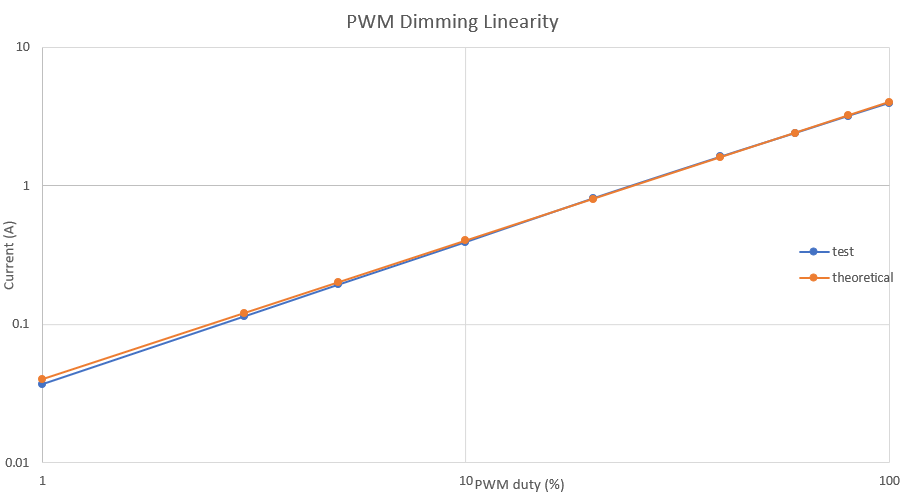
Figure 5-10 gives the test result of linearity of PWM dimming, in comparison with the theoretical value. Input voltage is 48V, with 7 white LEDs in series used as load. The full-scale LED current is set at 4 A. The frequency of the input PWM signal at the PWM/EN pin is 20 kHz.
 Figure 5-10 PWM Dimming Linearity