SLVAFD5 December 2022 TPS562211 , TPS562212 , TPS563211 , TPS563212
2 Transient Response Comparison
Three power supplies were chosen to demonstrate the performance of each control mode under the same operating conditions:
- PCM buck converter Part1 switching at 600 kHz
- D-CAP2 buck converter Part2 switching at 580 kHZ
- AECM buck converter TPS563211 switching at 600 kHz
Operating frequencies were selected as close as possible, allowing every design to use the same output filter.
Table 2-1 shows all device configurations. The inductor chosen for all designs is the Wurth 74437349033, which is a 6-A, 0.019-mΩ, 3.3 uH coil. Output cap are composed by 2 × 22 uF TDK C3216X5R1V226M160AC, and 0.1 u Kemet C0603C104K5RACAUTO.
| Part Number | Control Mode | Fsw | Inductor | Output Capacitance |
|---|---|---|---|---|
| Part1 | PCM | 600 kHz | 3.3 uH | 44 uF+ 0.1 uF |
| Part2 | DCAP2 | 580 kHz | 3.3 uH | 44 uF + 0.1 uF |
| TPS563211 | AECM | 600 kHz | 3.3 uH | 44 uF + 0.1 uF |
The D-CAP2 control mode is nonlinear, its Bode plot is difficult to measure because the feedback loop is not fully disconnected internally. We use load transient to represents the dynamic performance. We performed load-transient test with a 0 A to 3 A, 0.3 A to 2.7 A, 1.5 A to 3 A load step with slew rate of load is 2.5 A/μs. Figure 2-1 to Figure 2-9 show the transient response difference of PCM, DCAP2, and AECM parts.
Comparing the transient response waveforms shown as below of three control modes. AECM and D-CAP2 with an emulated ramp-generator circuit integrated inside IC have an advantage over the PCM solution, with a smaller voltage overshoots and undershoots. Table 2-2 shows the results.
| Part | Output Voltage Peak-Peak | ||
|---|---|---|---|
| Transient(0A-3A) | Transient(0.3 A-2.7 A) | Transient(1.5 A-3 A) | |
| Part1 | 520 mv | 408 mv | 264 mv |
| Part2 | 268 mv | 280 mv | 196 mv |
| TPS563211 | 220 mv | 220 mv | 160 mv |
The following images are the application curves.
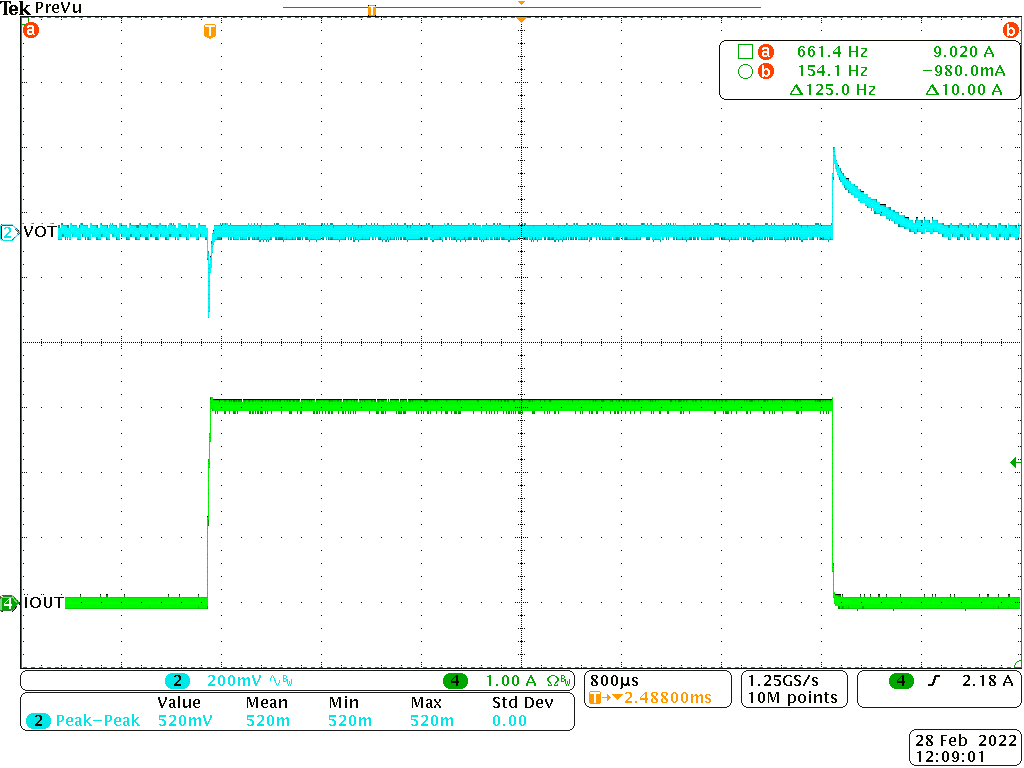 Figure 2-1 Part1 PCM Transient Response 0A-3
A
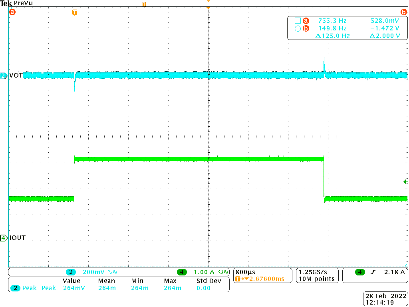 Figure 2-3 Part1 PCM Transient Response
1.5A-3A
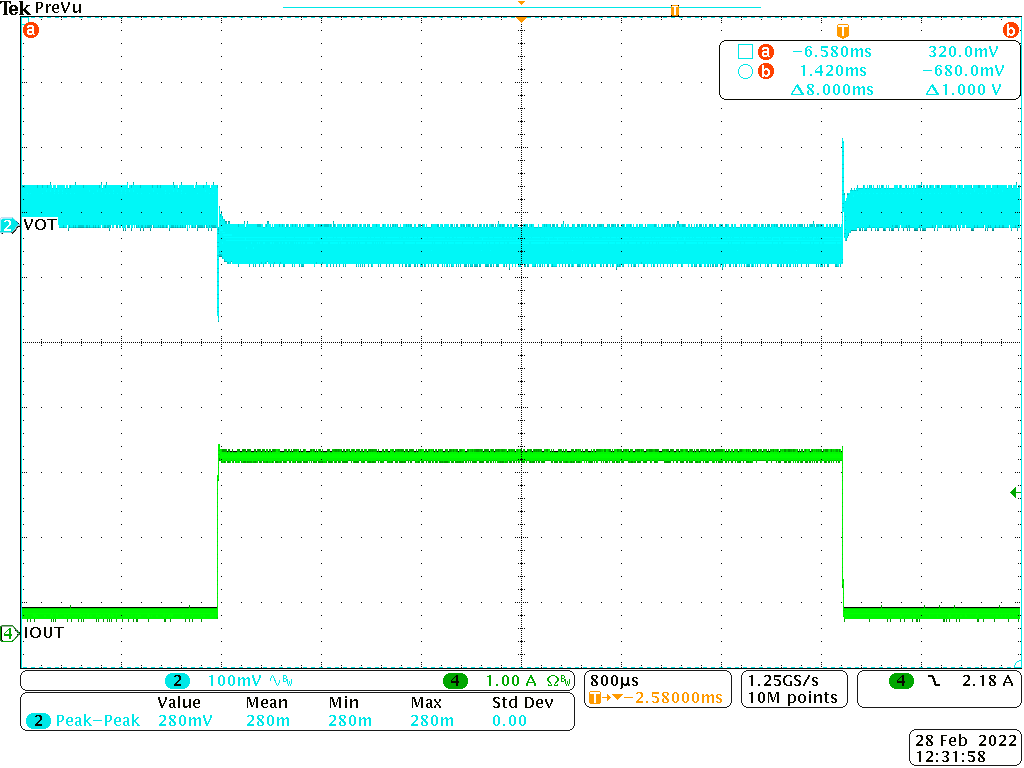 Figure 2-5 Part2 DCAP2 Transient Response
0.3A-2.7A
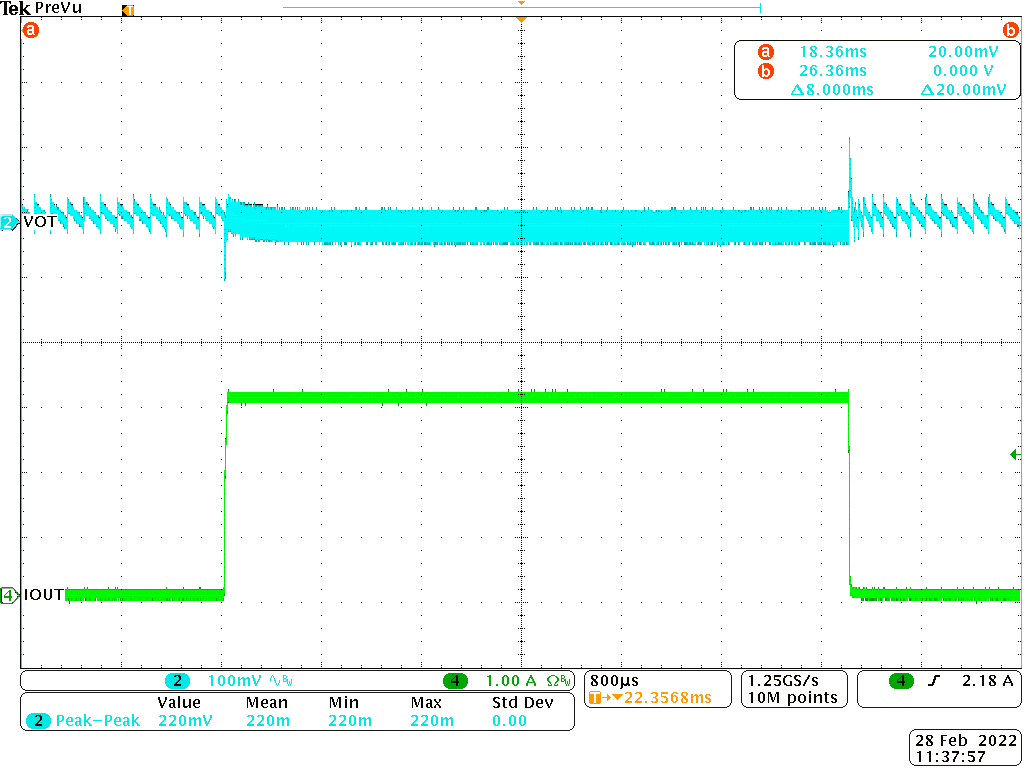 Figure 2-7 TPS563211 AECM Transient Response
0A-3A
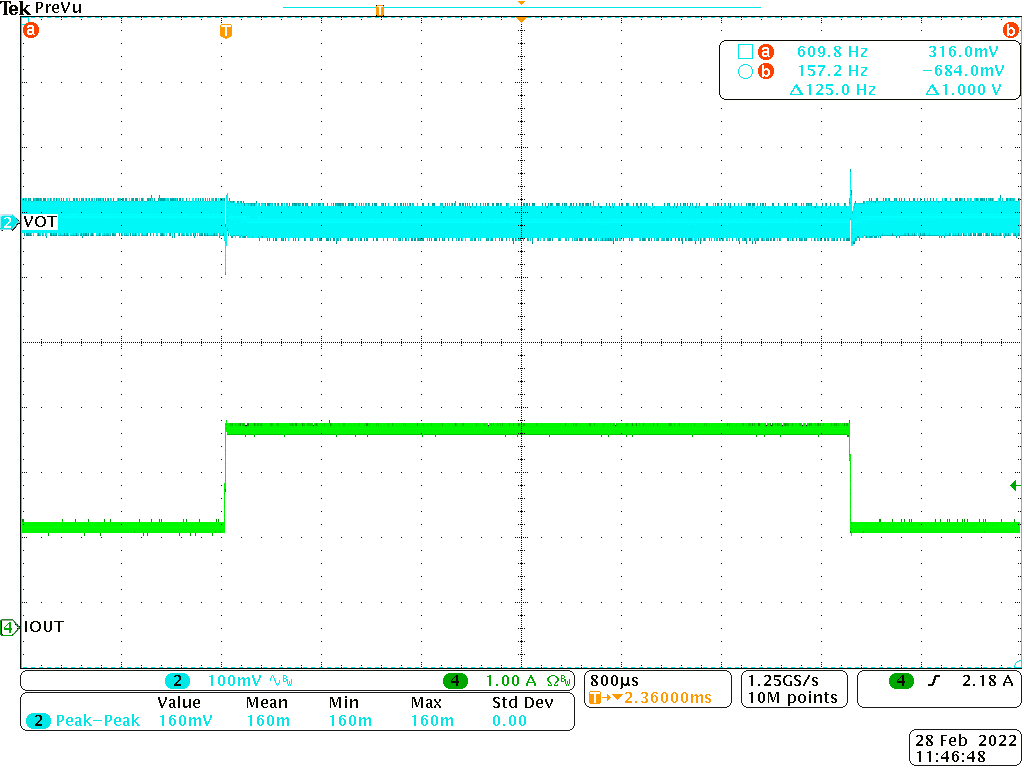 Figure 2-9 TPS563211 AECM Transient Response
1.5A-3A
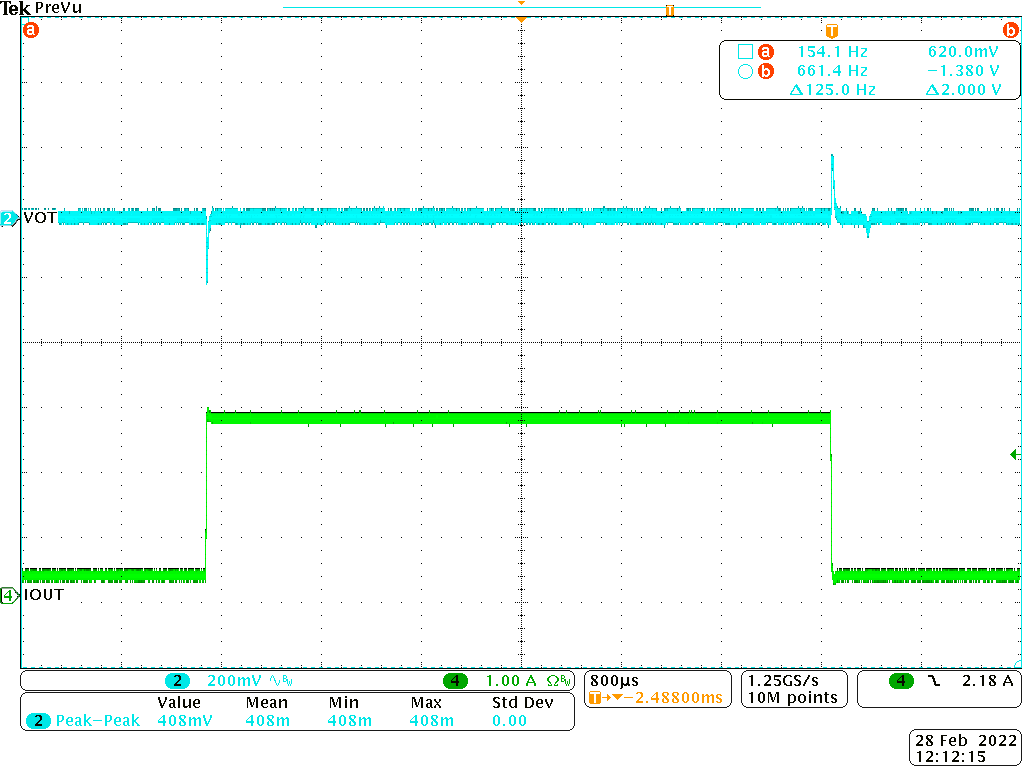 Figure 2-2 Part1 PCM Transient Response
0.3A-2.7 A
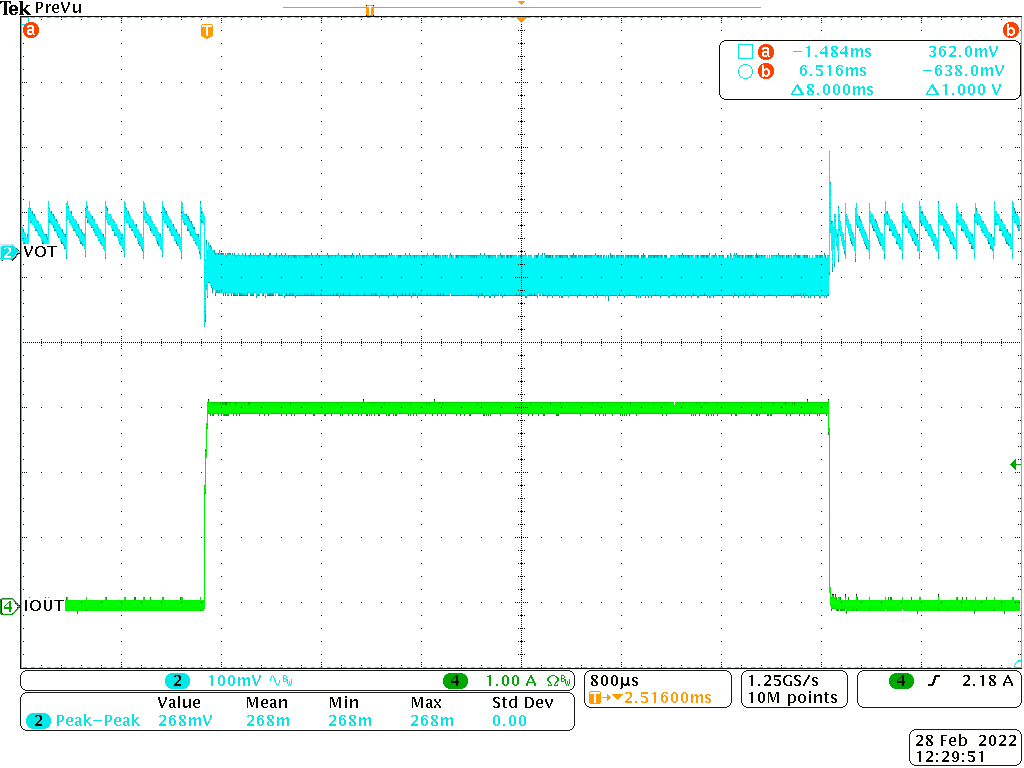 Figure 2-4 Part2 DCAP2 Transient Response
0A-3A
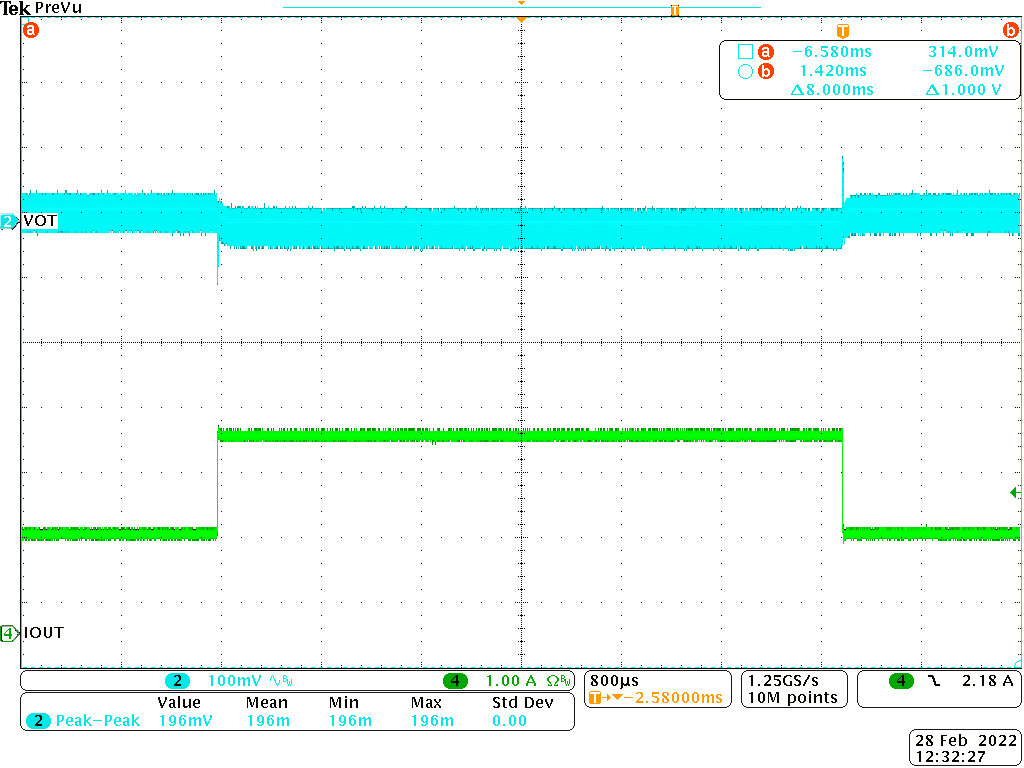 Figure 2-6 Part2 DCAP2 Transient Response
1.5A-3A
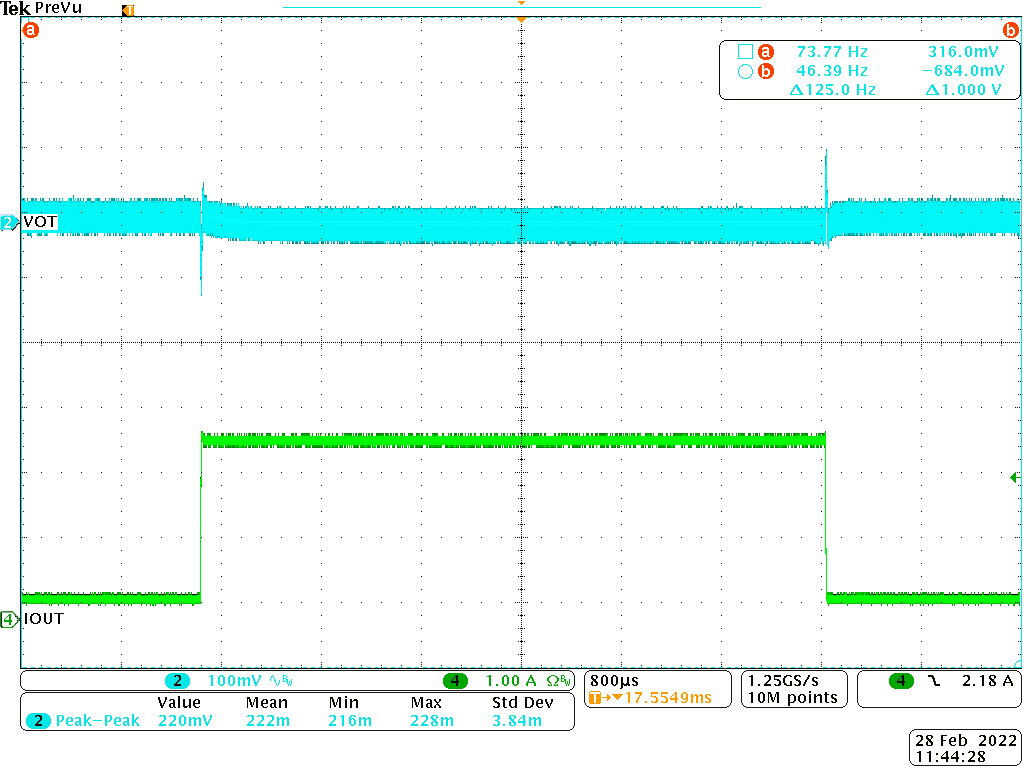 Figure 2-8 TPS563211 AECM Transient Response
0.3A-2.7A
Figure 2-8 TPS563211 AECM Transient Response
0.3A-2.7AFigure 2-10 to Figure 2-12 show the switch-node waveform of three control modes during a transient load step. We can see the PCM and AECM has a fixed frequency during load transient when working at CCM, and it’s easy to deal with EMI. And for D-CAP2 control topology, the off-time will be adjusted to respond the load transient, so the switching frequency is pseudo-fixed.
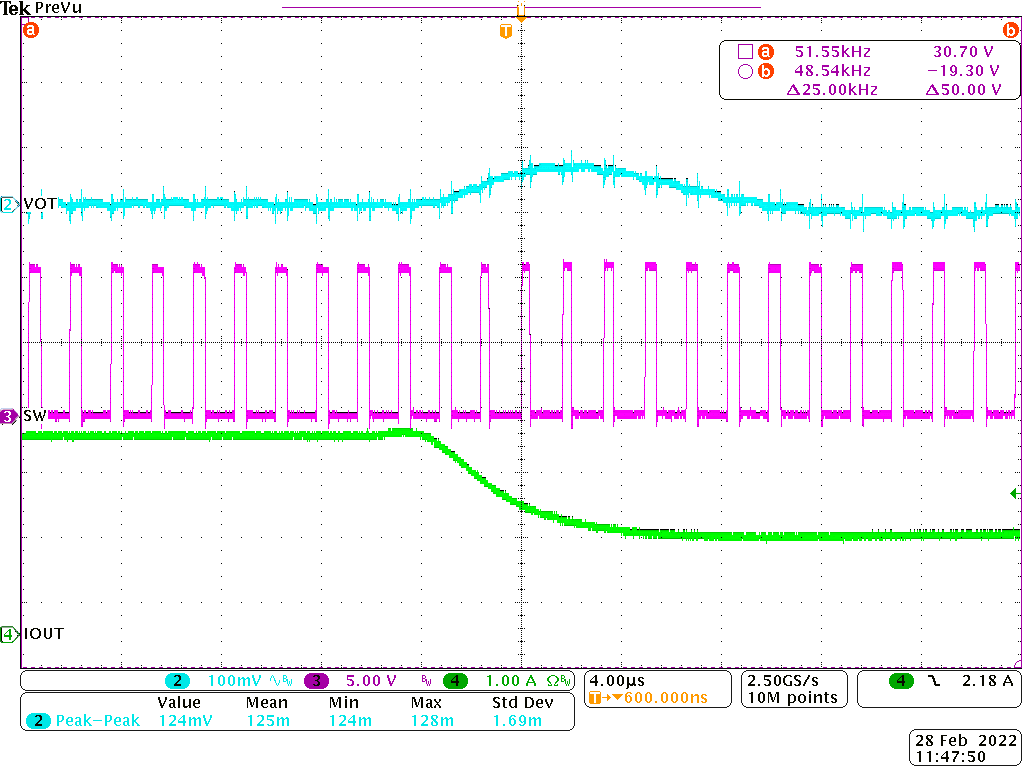 Figure 2-10 AECM Transient Response 1.5 A-3 A
(Zoom in)
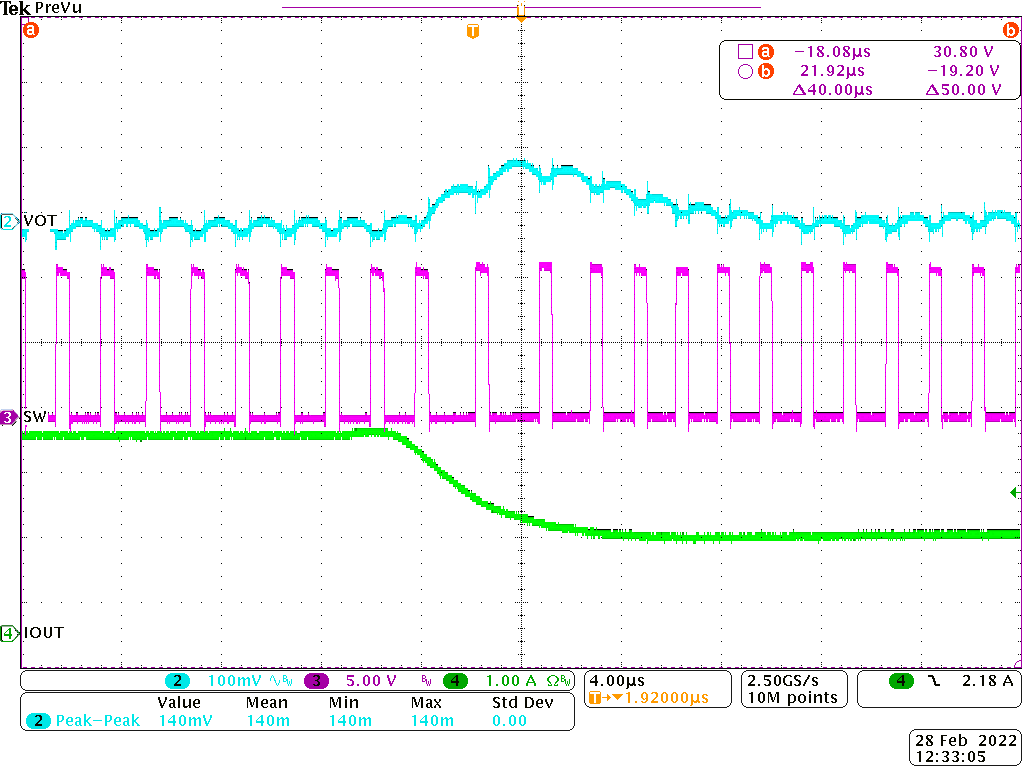 Figure 2-12 DCAP2 Transient Response 1.5 A-3 A
(Zoom in)
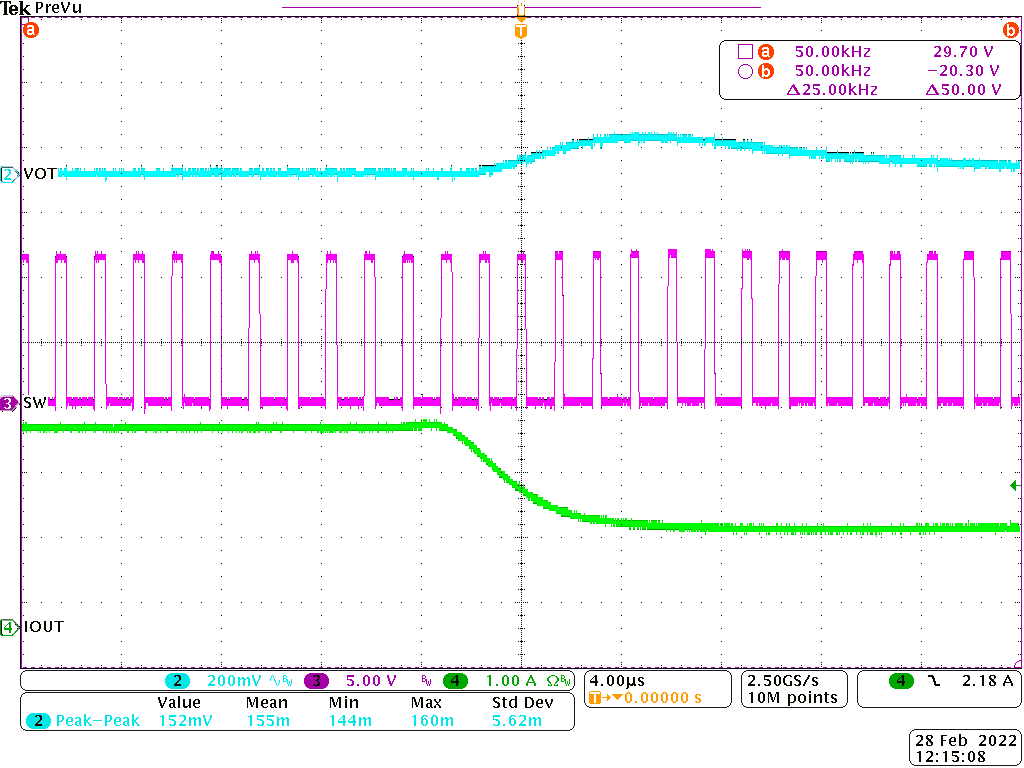 Figure 2-11 PCM Transient Response 1.5 A-3 A
(Zoom in)