SNLA421 December 2022 DS320PR810 , SN75LVPE5412 , SN75LVPE5421
3.2 Effects of EQ Index on the Eye Diagram
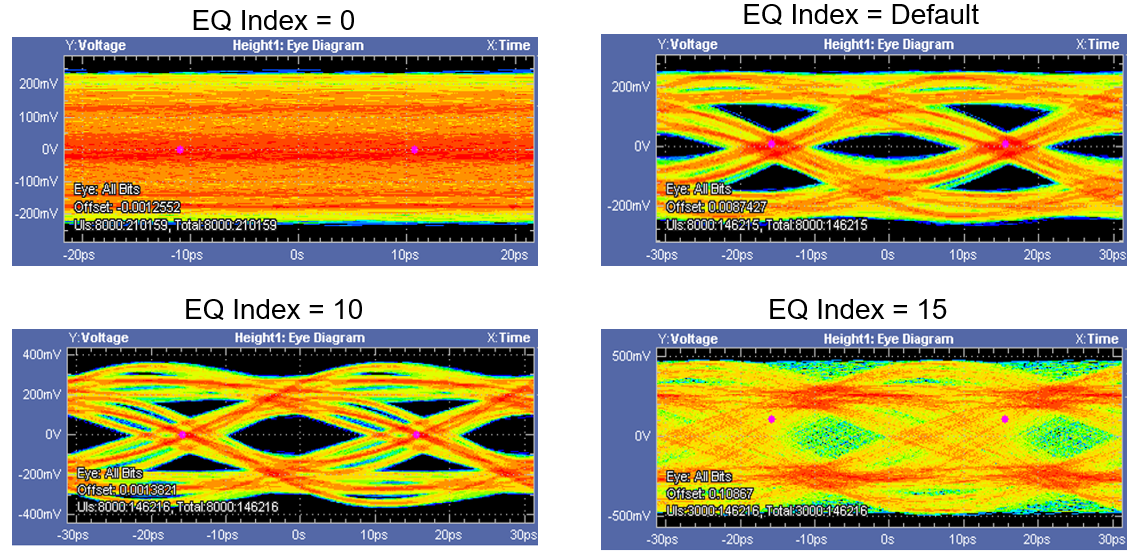
To further understand the importance of linearity when adjusting the EQ Index, the eye diagrams for each index are displayed in Figure 3-3.

Figure 3-3 Redriver Output Eye Diagram vs. Different EQ Index Settings
The eye diagrams comparing the output of the redriver at different EQ Indices highlight the importance of the redriver’s linearity. At the EQ Index 0, it can be observed that the signal is very under equalized, as there is no eye opening at all. At the default EQ Index, it can be observed that the signal is still slightly under equalized, as the eye opening is larger but not completely open. However, it is important to mention that if a short trace lies between the output of the redriver and the end point receiver, it is preferred to operate with the redriver under equalizing. This allows a higher linearity in the signal, while allowing the root complex and endpoint to do FIR training and optimization. At EQ Index 10, the eye opening is much larger and the voltage level of the signal has also increased. While it may appear that the eye is over equalized, there is good eye opening. In a system where a long trace lies between the redriver output and endpoint, then EQ Index of 10 is preferred. This is because the additional de-emphasis in the signal would help to compensate for this long trace. At EQ Index 15, the eye completely closes again even with a higher signal voltage level, indicating that the channel was over equalized. Thus, it can be determined that an ideal EQ Index lies between [5, 15); this range of EQ indices can be narrowed down with further testing. Table 3-2 shows the vertical eye opening (VEO) and horizontal eye opening (HEO) values, along with the jitter profile after the redriver for each EQ Index in the tests performed.
Note that the ideal eye was captured with an EQ Index in the range of [5,15). In the previous section, the amplitude of the high frequency time domain component increased with each increase of the EQ Index; however, not every increase of the EQ Index produced an improved eye diagram. While the amplitude of the time domain signal at the output of the redriver was larger at EQ Index 15, the better eye opening was produced at EQ Index 10.
| EQ Index | VEO (mV) | HEO (ps) | TJ (ps) | RJ (ps) | DJ (ps) |
|---|---|---|---|---|---|
| 0 | 0 | 0 | 77.651 | 3.778 | 24.507 |
| Default | 70.265 | 10.908 | 20.343 | 0.577 | 12.228 |
| 10 | 178.54 | 13.830 | 17.420 | 0.407 | 11.696 |
| 15 | 0 | 0 | 37.410 | 0.346 | 32.545 |